 Walkably
Walkability data for research across 31 countries
Compare any two places in Europe with one score, from 0 to 100, for every 55 m street cell. The score is tested against census data, and failed tests are published. We send you the full data file; it is open to copy and cite with credit.
- 31European countries, one method
- 477city pages, in the local language and in English
- A score for every 55 m cell with a street
- Checked against three censuses, with failed checks published
How you can use the data
Research needs a walkability measure that works the same way in every country. Few official statistics measure walking access, and none does it the same way across borders. Creating your own score from OpenStreetMap takes weeks to months of staff time, by our estimate. Walkably gives you one number per 55 m street cell across 31 countries. Here are kinds of published work it can support.
Health research and home environments
Health studies often evaluate the surroundings near each person's home. A study in The Lancet covered 14 cities (Sallis et al., 2016; 6,822 adults) and measured walkability, transit and park access around each home. The authors examined areas within 0.5 km and 1 km along streets. Walkably gives you the score and walking minutes to each service for every cell in that zone. Try any address on the live map.
15-minute city and proximity studies
Bruno, Melo, Campanelli and Loreto (Nature Cities, 2024) created a framework to measure access times to services in cities worldwide. Bartzokas-Tsiompras and Bakogiannis (Journal of Maps, 2023) ranked 121 European metropolitan areas by walking access to seven kinds of amenity. Walkably measures the walk to eight needs on real streets at 80 metres a minute. Nothing counts past 20 minutes. You can compare 477 cities or any smaller area with one method.
Monitoring access for UN Sustainable Development Goals
SDG indicator 11.2.1 counts people who live within 500 m of a public transport stop along streets, or 1 km for rail. Indicator 11.7.1 measures access to open public space. The OECD reports the share of city residents who can walk to a primary school in 15 minutes. Walkably isn't one of these indicators. It can help you check them or supply data to them. It holds the minutes to a stop and to a park for every cell.
Evidence for policy and public advocacy
A walking NGO or a foundation needs a number it can explain to a city council. Our district rankings order the official districts of a city by score. Districts with too few buildings are listed without one. Each row also shows the minutes to groceries and to a stop. The method is public, so anyone can check how a number was made.
Data journalism and reporting
Reporters need a plain method and a file they can open easily, as well as a person to ask. Each district ranking comes with a CSV download, which is a plain table file. The About page explains in simple words how the score is built. It also says where the score doesn't agree with other data.
Sample output: 93 of Hamburg's 104 districts ranked
This is a real ranking, published on the site. All 104 official districts of Hamburg are listed. The 93 districts with enough buildings are ordered by the middle (median) score of their buildings. Half of a district's buildings score higher, and half lower. The other 11 have too few buildings for a score. St. Pauli, Eimsbüttel and Sternschanze come first, with 87.4, 87.0 and 86.8. Altengamme, a rural district of Bergedorf, comes last at 30. There, groceries are 16.2 minutes away on foot. The table sorts by any column, and you can download the whole table as a CSV.
The online table
The table shows rank, district, borough, score, minutes to groceries, minutes to a stop, and buildings. The count of 55 m cells per district is in the CSV only.
The CSV download
The file holds one row per district, with one decimal on the score. You can open it in any spreadsheet or statistics program.
Rankings for other cities
We make the same ranking for the districts of your city on request; we confirm the date when you ask.
Rank,District,Borough,Walkably score (0 to 100),Minutes to groceries,Minutes to a stop,Buildings,Cells (55 m)
1,St. Pauli,Hamburg-Mitte,87.4,1.8,2.7,1765,266
2,Eimsbüttel,Eimsbüttel,87.0,2.2,2.5,3319,412
3,Sternschanze,Altona,86.8,1.3,2.8,634,69
4,St. Georg,Hamburg-Mitte,86.4,1.9,2.4,1086,186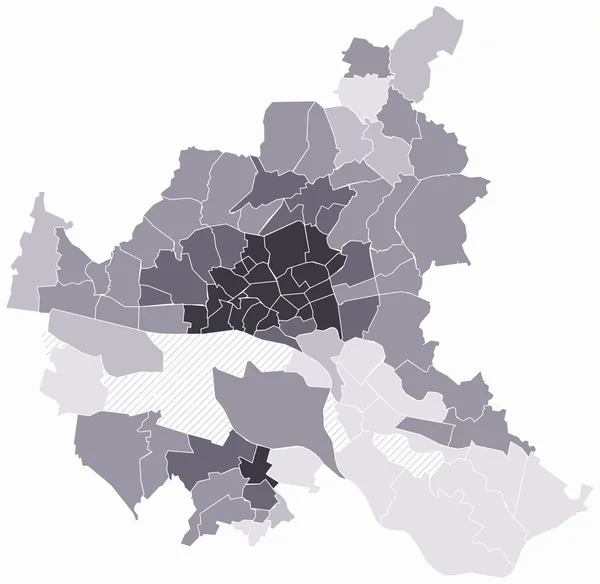
Free open copy and what the licence allows
The scores are built mostly from OpenStreetMap, the open map of the world. They're shared under the same licence, the Open Database License (ODbL). Write to us and we send you the file. You use it under the terms below, with no further permission from us.
What the open copy is
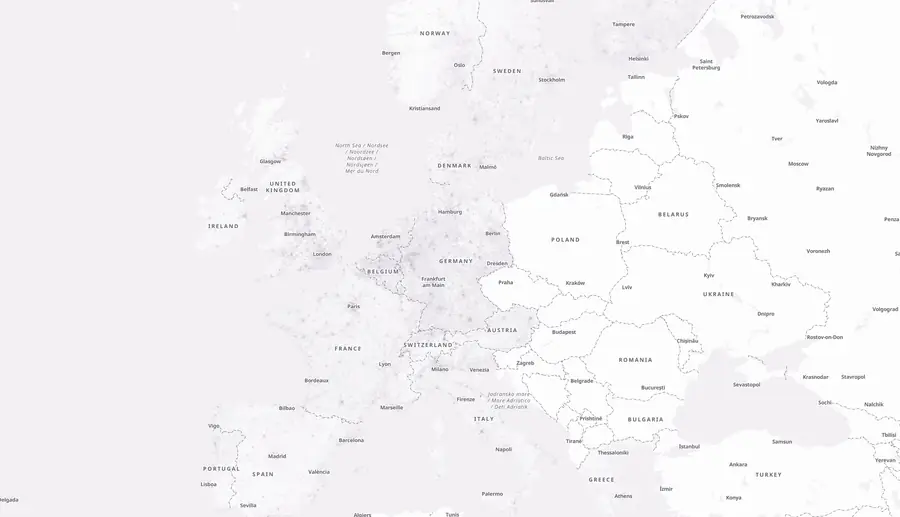
We send you one map file, europe.pmtiles, when you write to us. PMTiles is a format that keeps all map tiles in one file, so a map program can read any part of it. It's a large file of several gigabytes, and holds the score layers for all 31 countries. It's the same file the live map reads.
What you can do
You can copy, change, share and use the data in commercial work. A map or paper made from the data as published needs the credit only. If you change the database and publish a map or paper from the changed version, you must also offer the changed database, or your changes, under the ODbL.
The credit you must give
Credit OpenStreetMap with the line below, in your paper, your map or your app. Two layers come from public maps: the Barcelona noise map and EU tree cover. Slope comes from terrain data. Their credit lines are in the licence table on the About page, section 2. Use the credit lines for the layers you use. If you share a changed version of the database, share it under the ODbL too.
Limits of the open copy
It's a map file, not a table. It isn't limited to your study area, and it doesn't come with help. A table of your area in your format, updated scores, or method support is work on agreed terms. See the next section.
Contains information from OpenStreetMap, © OpenStreetMap contributors, https://www.openstreetmap.org/copyright, available under the ODbL.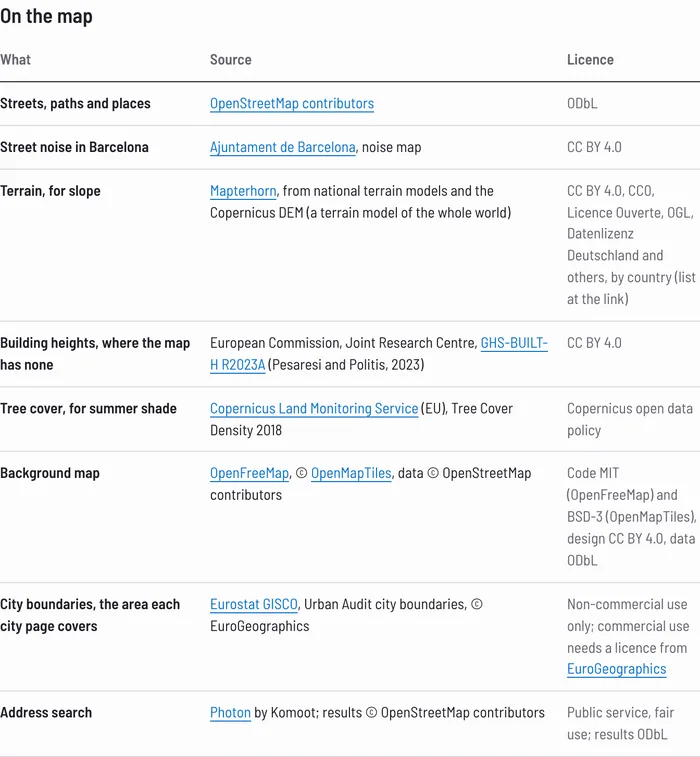
Work on agreed terms
Research and public-interest projects pay for data work through grants and project budgets. We write the scope, delivery date and terms in the exact form your grant or procurement office needs. Tell us the project and the area you need, and we agree on the scope and terms. Everything beyond the open copy is done this way. We don't publish prices, because each project differs in area and format. Time requirements differ too.
Custom study areas
Scores and minutes can cover your study area, your list of addresses, or your own small census areas and health districts. You don't need to send names or health data. Send coordinates or addresses without names.
You get one table, ready to join with your own data.
Updated scores
A new calculation of the score for your area when you need it. It comes with the date of the map data it was built from.
Your paper states when the data was measured.
Delivery in the format you need
CSV, GeoPackage, GeoJSON or Parquet, by cell, by address or by your zones. We deliver it where you want: a file or cloud storage, or an API arranged for the project.
No conversion work on your side.
Method support
A written method note for your paper or report. Answers on how each part of the score was built, with the limits named.
A reviewer's question gets a documented answer.
Joint validation studies
We compare the score with reference data you trust. That can be a national travel survey, health data, pedestrian counts, or official stop data for SDG 11.2.1 in one country. We set the pass mark before we see a result. We publish the outcome either way, unless the data owner's terms forbid it.
A test of the kind the authors of the European walkability index (Patel et al.) say is still needed.
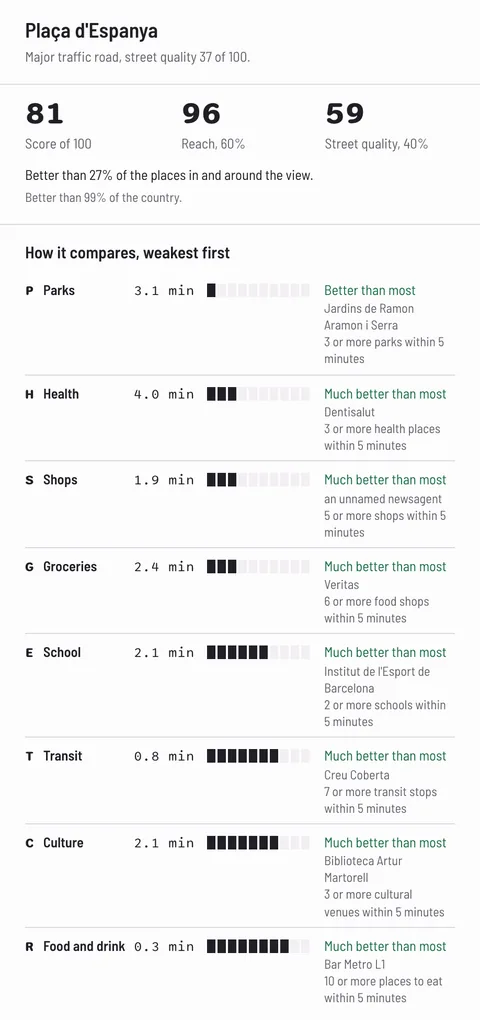
| Field in each record | Example: Plaça d'Espanya, Barcelona |
|---|---|
| Score, 0 to 100 | 81 |
| Reach (60% of the score): the walk to eight daily needs | 96; all eight needs within 4 minutes on foot |
| Minutes to groceries, food and drink, shops, health, school, parks, culture, public transport | One figure per need, with the nearest named place |
| Street quality (40%): traffic from the street type, speed and lanes on OpenStreetMap; noise where a city publishes a noise map (today Barcelona); summer shade; busy roads nearby; slope | 59; loud and busy streets |
| How the score is made | 96 × 0.6 + 59 × 0.4 = 81.2, shown as 81 |
If street quality is under 40, the total stays at 69 or lower. A place close to everything on a loud, busy road can't reach the top scores. The example is Figure 2 on /about.
Why the score can be trusted and cited
A walkability score is only useful if it agrees with how people really move. We compared our score with the census in France, in England and Wales, and in Ireland. In each city, we ordered the neighbourhoods by the share of people who walk to work. Next, we ordered them by our score. We then measured how well the two orders agree, from −1 to 1 (a rank correlation). We set the pass mark at 0.35 before we saw a single result. All three countries passed. We publish all seven of our checks: four passed and three failed.
| Check | Agreement | Agreement | Pass mark | Result |
|---|---|---|---|---|
| France, neighbourhoodsINSEE census 2021, walk to work; middle city of 28 | 0.73 | 0.35 | Pass | |
| Ireland, neighbourhoodsCSO census 2022; middle of 34 counties and cities | 0.68 | 0.35 | Pass | |
| England and Wales, neighbourhoodsONS Census 2021; middle of 301 council areas | 0.62 | 0.35 | Pass | |
| Busy roadsStreet audit of 43 European city centres (Bartzokas-Tsiompras and Photis, 2021) | 0.56 | 0.40 | Pass | |
| Cities against citiesEurostat city walking shares, 195 cities in the first 20 countries on the map | −0.04 (0.43 for walk or public transport) | 0.50 | Fail | |
| Summer shadeTree cover in the same 43 city centres | −0.18 (0.27 for trees alone) | 0.40 | Fail | |
| Ten US cities, run only to test the methodAmerican Community Survey 2020 to 2024, about 3,000 small census areas | 0.34 | 0.35 | Fail, narrowly |
All figures as published on /about#checks on 14 October 2026; the About page is the live source. Rank correlation, −1 to 1. We report both versions of a failed check and don't change the score to make them pass.
The formula was fixed before the second test
We chose the formula on France. Then we ran England and Wales without changing anything, and it passed there too.
The limits, stated
Walking to work is only one kind of walking; that's why the pass mark is 0.35 and not higher. In Paris, where almost everything is a few minutes away, the match is only 0.18. The 2021 census in England and Wales took place during a COVID lockdown.
Map completeness differs across countries
The score has the same gaps as the map it's built on. Where few shops are mapped, the walk to shops looks longer than it is. One of the joint studies we offer measures this: how the score changes, country by country, when the map is more or less complete.
The method is public
The About page gives the eight needs and the walking speed of 80 metres a minute. Nothing counts past 20 minutes. It notes that second and third nearby places count, and gives the 60/40 weights along with the five street-quality parts. It states the rule that keeps the total at 69 or lower when street quality is under 40. Every data source and its licence is listed there too.
How it compares with free indexes
Good free indexes of European walkability exist, and the About page names them. This table shows where Walkably differs. Every row about another project was checked against that project's own page on 14 October 2026.
| - | Walkably | 15min City Score Europe Map (Transform Transport) | European walkability index (Patel et al., preprint) | Build it yourself from OpenStreetMap |
|---|---|---|---|---|
| Coverage | 31 European countries, every place with a street | 786 urban areas above 50,000 people, in the 38 member countries of the European Environment Agency plus the UK | 38 countries | Anywhere OpenStreetMap covers |
| Cell | 55 m six-sided cells (about 0.008 km²) | Six-sided cells, about 174 m edge (about 0.105 km²) | 100 m squares (0.01 km²) | Your choice |
| What it measures | Walking minutes on real streets to eight needs; a longer walk earns fewer points | Access on foot within 15 minutes to eight service types | Street length and intersection counts, among other parts | What you build |
| Street quality (traffic, noise, shade, slope) | Yes, 40% of the score | Not stated | Slope and greenness; no traffic, noise or shade | Your work |
| Checks against census or survey data | Yes, four passed and three failed, all published | Not stated | Authors say validation with walking data is still needed | Your work |
| Licence | ODbL, stated | Not stated on the page we read; dataset on Zenodo | Not stated for the data | ODbL |
| How you get it | Open map file now; tables, updates and support on agreed terms | Dataset download on Zenodo and a web map | Web atlas and code | Weeks to months of staff time, in our estimate |
Rankings from different tools disagree because the list of needs, the cut-offs and the cell sizes differ. Do not compare scores from two tools directly.
How to cite the data
Cite the site, the area and the date you read the score, and keep the credit line for OpenStreetMap. Reviewers can ask us for the date of the map data behind the score. The method page is the reference for how the score is built.
In a paper or report
Use the line below, and replace the area and the date. If we deliver a table on agreed terms, we give you the date of the map data behind it. Cite that date.
On a map or in an app
Show the OpenStreetMap credit line on or next to the map. Add the credit lines of the other layers you use (About page, section 2). Please also add 'Score: Walkably, walkably.org'.
When you cite the checks
Cite /about#checks and the date. The figures there can change when a check is re-run, and we keep all the pass marks fixed.
Pollock, R. Walkably: walkability scores for 31 European countries. walkably.org. Score for [area], read on [date]. Method: walkably.org/about. Data © OpenStreetMap contributors, ODbL; other sources as credited at walkably.org/about.Questions buyers ask
What does the data cost?
The full open copy is free. It's one map file. Write to us and we send you the file, to copy, change and share with credit under the ODbL. Work beyond it is done on agreed terms. That means a table of your area, updated scores, a format you need, method support or a joint study. We don't publish prices. Write to [email protected] with your project, and we reply with a scope and terms.
Can you work with a grant or a public contract, or be named as data provider in a proposal?
Yes. Write to [email protected] with the call and its deadline, and the area. We reply with a scope and terms in the form your grant or procurement office needs. We're open to a data-provider role in a funding proposal and to a joint paper.
Do we have to send personal data for a custom area?
No. You don't need to send names or health data. Send coordinates or addresses without names. Zones can be small census areas or health districts. We return one table that you join with your own data on your side.
Which licence covers the data, and what does it allow?
The Open Database License (ODbL) 1.0, the same licence as OpenStreetMap. You can copy, change, share and sell work built on it. A map or paper made from the data as published needs the credit only. If you change the database and publish a map or paper from the changed version, you must also offer the changed database, or your changes, under the ODbL. Credit OpenStreetMap with the line on this page, and the other layers' sources listed on the About page. The full licence text is at opendatacommons.org.
Which countries does Walkably cover?
Walkably covers 31 European countries. You'll find the full list just below this text. Every cell with a street is scored, in villages as well as cities. City pages exist for 477 cities of about 100,000 people or more.
- Andorra
- Austria
- Belgium
- Bulgaria
- Croatia
- Cyprus
- Czechia
- Denmark
- Estonia
- Finland
- France
- Germany
- Greece
- Hungary
- Iceland
- Ireland
- Italy
- Latvia
- Liechtenstein
- Lithuania
- Luxembourg
- the Netherlands
- Norway
- Poland
- Portugal
- Slovakia
- Slovenia
- Spain
- Sweden
- Switzerland
- the United Kingdom
Can we reproduce the score?
The method is public on /about. It lists the eight needs and the walking speed of 80 metres a minute. Nothing counts past 20 minutes. It notes that second and third nearby places count too. It details the 60/40 weights, the five street-quality parts, and all data sources with their licences. The exact curve that turns minutes into points, and the weights inside street quality, aren't on the About page; ask us if your study needs them. Because the scores are open, anyone can re-run our census checks or run other checks. The code that builds the score isn't open source.
Your checks use walking to work only, and some failed. Why?
Walking to work is the one kind of walking three censuses count at neighbourhood level, so it's our reference data in three countries. We set the pass mark at 0.35 for that reason. We publish every failed check. You should know where to be careful. The city-level Eurostat check fails partly because large metro cities have low walk-to-work shares. The shade check fails partly because the street audit counts trees only, while we also count building shadow. We report both versions of each failed check and don't change the score to make them pass. A test against a travel survey or health data is the joint study we most want to do.
Can we co-author a validation study?
Yes, on agreed terms. You bring reference data, such as a travel survey or health data, while we bring the scores and the method. The pass mark is set in advance. We publish the result either way, unless the data owner's terms forbid it. We're open to a joint paper, or to a data-provider role in a funding proposal.
Coming soon for research
Planned work that matters for research use.
- District rankings for more citiesThe Hamburg format, with CSV download, for more cities.
- More local languagesCity pages in more of the languages people speak in the 31 countries.
- A population and age layerHow many people, and of which ages, live at each score.
- More countriesThe same method in more countries beyond the 31 we cover today.
Tell us about the project
You write to us, we agree the scope, and you receive the table with the date of the map data. One email to [email protected] is enough to start; tell us five things. Raian Pollock built the score. He answers every email. The live map is free to try first, with no form.
[email protected]The question
What you want to learn or show, in one or two sentences.
The area
A country, a city, a list of addresses without names, or your own zones.
The format
CSV, GeoPackage, GeoJSON, Parquet, or an API for the project.
The timeline
When you need the data, and whether a grant deadline is behind it.
Validation
Whether you hold reference data we could test the score against, and whether a joint study interests you.