 Walkably
Walkability data for property developers in Europe
Walkability means how easy it is to reach daily needs on foot. Rank your plots by walking minutes to eight daily needs. Add the figures to a site study. They also support certificate files and mobility concepts.
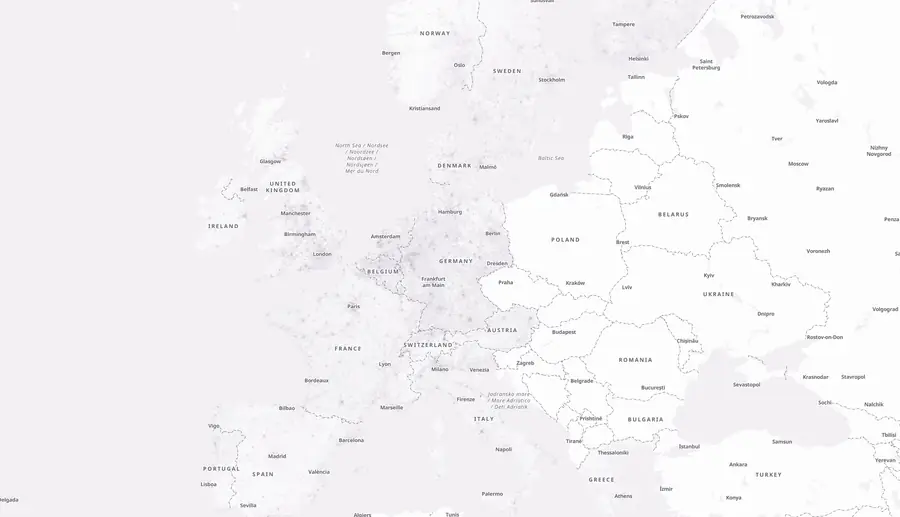
- 31European countries, one method
- 477city pages
- A score for every 55 m cell with a street, shown as a six-sided map patch
- Minutes on foot to 8 daily needs, per address
- Checked against census data in three countries, with failed checks published too
Where site decisions need walking figures
A site study (in German, a Standortanalyse) covers price, size, planning rules and demand. It describes close surroundings (Mikrolage) and local shops (Nahversorgung) in words. Giving walking access only one sentence leaves three gaps.
Two plots look equal in the site study
Price and size can match. One plot has a grocery store and a tram stop a short walk away. The other has a busy road between the plot and everything else. The site study doesn't show this difference.
Applications and certificates ask for a measured distance
Green-building certificates ask for the distance from the site to shops or public transport, using a stated method. A mobility concept asks the same. That's a document filed with the building application about how residents will travel. Both need a figure per site that a reviewer can check, with the method stated.
Brochures say 'close to shops' without a figure
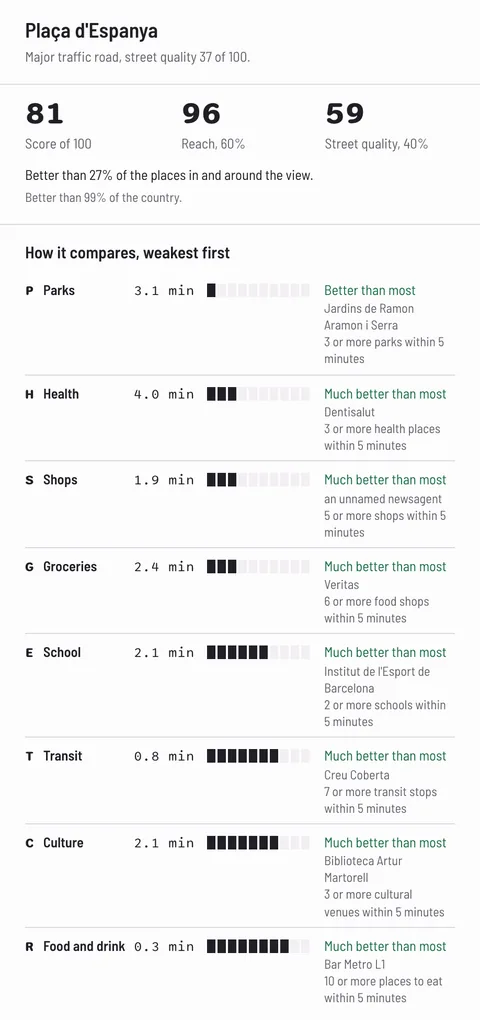
A project page that describes a location in general words gives buyers or tenants nothing to check. A line like 'all eight daily needs within 4 minutes on foot' can be checked on our free map. That's what the map shows for Plaça d'Espanya in Barcelona.
Three decisions, one file
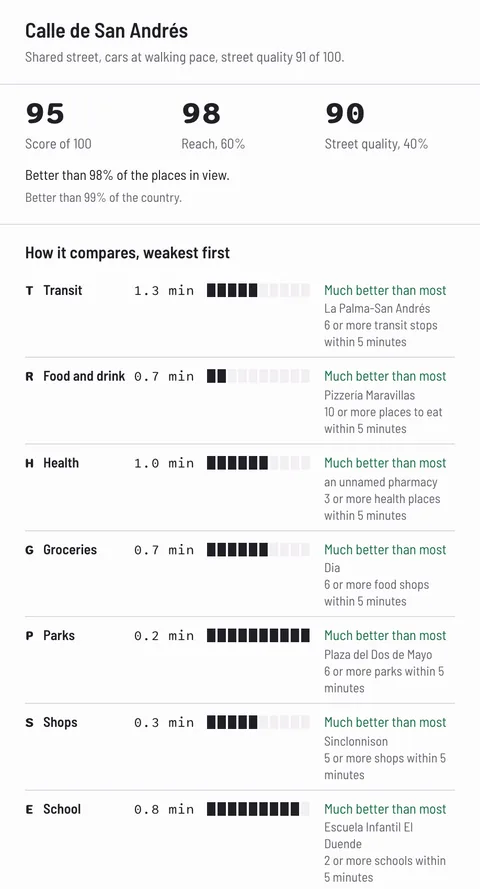
Each address gets a walkability score from 0 to 100 and the minutes on foot to eight daily needs. It also gets the parts of street quality. The same file serves three decisions.

Site selection
Send the addresses or areas of your plots in any of the 31 countries. You receive one score per address or area. You also get the minutes on foot to groceries, food and drink, shops, health, school, parks, culture and public transport. Sort the list, or put two plots side by side, need by need.
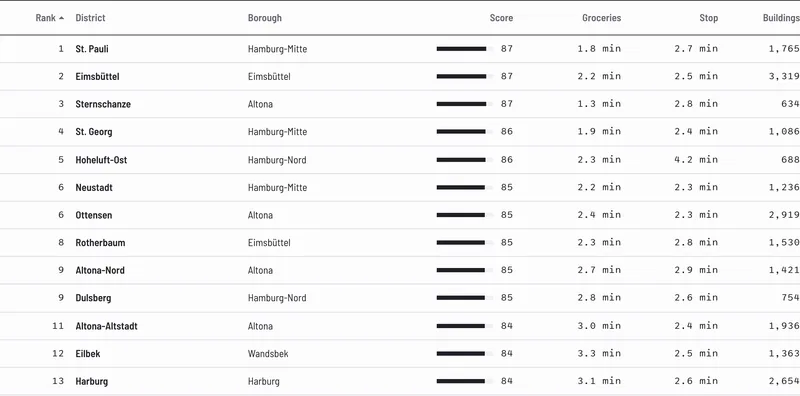
The best plots ranked on what residents can reach on foot, with the figures behind each rank.
Marketing a project
Replace 'well connected' with the walking minutes from the site to groceries and public transport. The figures come from a published method. We measure on real streets at 80 metres a minute, so a phone route planner may show other minutes. Anyone can check a single spot free on our map.
Location claims in a brochure or website that a reader can check on our map.
Green-building certificates and parking
The 2023 version of DGNB, a German green-building certificate, scores a supermarket within 700 m in a straight line (criterion SITE 1.4). It asks for a real path only where a barrier blocks the way. BREEAM is a British green-building certificate used in many countries. It measures the walking route from the main entrance to each public transport stop. BREEAM also asks how often buses or trains run, which our file does not include. Our walking minutes follow real streets from the 55 m address cell, so they are longer than a straight line. Some cities allow fewer parking spaces when the application shows good public transport and local shops. Munich is one example.
Walking minutes per address to attach to a certificate file or mobility concept. DGNB and BREEAM set their own evidence rules, so ask the certificate body first.
See real output before you write to us
Free single checks on the live map for anyone, 477 city pages and the Hamburg district ranking. Here's one real result, as shown on our method page.
Plaça d'Espanya, Barcelona: score 81
All eight daily needs are within 4 minutes on foot, so reach is 96. The streets are loud and busy, so street quality is 59. 96 × 0.6 + 59 × 0.4 = 81.2, shown as 81. Open the spot on the map to see minutes to each need and street-quality parts.
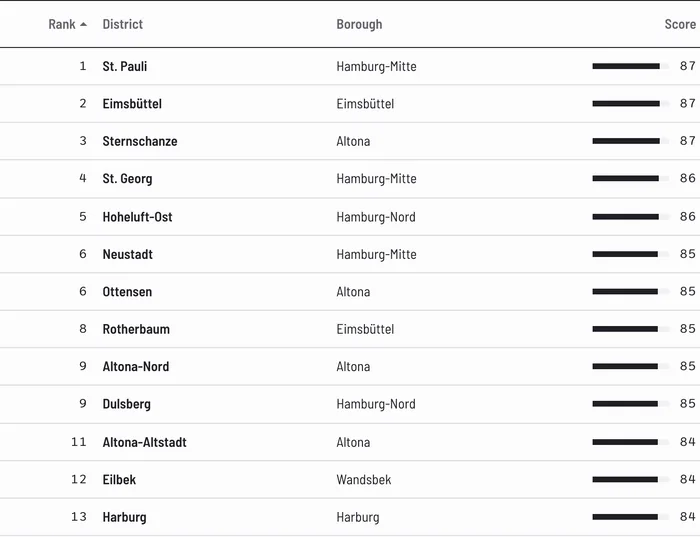
Hamburg district ranking: custom ranking for one city
93 ranked official districts out of 104. It includes a map and a sortable table, plus a CSV download (a table file that opens in a spreadsheet). You can also embed the table in your own page. The English version is linked here, and a German version exists. We build the same ranking for your city on request; we confirm the date when you ask.
477 city pages
For cities of about 100,000 people or more. Each page shows the typical score alongside the areas best and least served by daily needs on foot. It also reports the city's rank in the country. Use them to check a city before you look for land there.
Single checks on the live map
Type an address to read its overall score and walking minutes to each need. The tool also displays the street-quality parts. Free single checks for anyone.
What you receive for each site
You send a list of addresses or areas and receive one row per site in a file. The method is the same in every country.
| What each row contains | Detail | What you use it for |
|---|---|---|
| The walkability score | 0 to 100. Reach, the walking minutes to daily needs, is 60% of it. Street quality is 40%. | Rank plots; one figure per site in the recommendation to decision makers |
| Minutes on foot to each of the eight needs | Groceries, food and drink, shops, health, school, parks, culture and public transport. Measured on real streets at 80 metres a minute, from the 55 m cell that holds the address. | Compare two plots need by need; a brochure line; evidence for a certificate file or a mobility concept |
| The street-quality parts | Traffic, noise only where the city publishes noise maps, summer shade, busy roads and slope | Explain why a central plot scores lower than expected |
Your file holds your own sites. It gives walking minutes to public transport, but doesn't report how often buses or trains run.
Files for your own addresses or areas, on request
You get one row per site, ready for your own systems and for the recommendation document.
API access, arranged per customer
A connection that lets your own software ask for scores. The API page explains what a request returns.
Area and city reports, written for you on request
A report on an area or a city, written for you on request, for an investment check.
Custom rankings
For example, we cover every district of a city, as in the Hamburg ranking. This is made on request; we confirm the date when you ask.
Why you can trust the score
The method is published, and the scores are under an open licence. The checks are public, including the ones that failed.
The method on one screen
Reach means the walking minutes on real streets to eight daily needs. These include groceries, food and drink, shops, health, school, parks, culture and public transport. We walk at 80 metres a minute, never in a straight line. Reach is 60% of the score. Street quality is the other 40%. It covers traffic, noise where a city publishes noise maps, summer shade, busy roads and slope. When street quality is under 40, the score cannot rise above 69. This rule stops a place near everything but unpleasant to walk through from scoring high.
Checked against census data
We compared the scores with census data (the national count of people) on walking to work across neighbourhoods. Where more people walk to work, the score should be higher. We set a pass mark of 0.35 before we saw any result. Agreement reached 0.73 in France, 0.62 in England and Wales, and 0.68 in Ireland. Agreement is a rank correlation from -1 to 1. At 1 the two orders are the same. At 0 there is no link. We also ran it in ten US cities to test the method. We haven't run it in other European countries.
Failed checks are published too
Our score's agreement with Eurostat's city share of people who walk to work (Eurostat is the EU statistics office) was -0.04 against a pass mark of 0.50. For summer shade, agreement was -0.18 against 0.40. The ten US cities reached 0.34, just under 0.35. The busy-road part passed its check at 0.56. Shade stays part of street quality, so treat the shade part as an estimate, as the map itself says.
Open licence
We build the score from public data, mainly OpenStreetMap (a free world map built by volunteers). The scores and the OpenStreetMap data come under the ODbL open licence. You may copy and use them if you credit OpenStreetMap. If you build and publish a database from them, it must carry the same licence. Every other source keeps its own licence, listed on the method page.
How Walkably compares with what you use today
Compared on facts you can check yourself: coverage, what is measured, whether the method is public, whether results are tested, the licence, and how you buy.
| - | Walkably | Walk Score | 15-Minute City Score Europe Map (free) | Build your own from OpenStreetMap |
|---|---|---|---|---|
| Coverage | 31 European countries, every 55 m cell with a street | Its own pages list the US and Canada. Its public site shows scores for some European streets, labelled Unsupported Country | 786 urban areas above 50,000 inhabitants across Europe, in six-sided cells of about 0.105 km² | Anywhere OpenStreetMap covers |
| What is measured | Walking minutes on real streets to 8 daily needs, plus street quality: traffic, noise, shade, busy roads, slope | Walking distance to amenities; points fall as the walk gets longer, to zero past 30 minutes; plus block length, intersection density and population density | Walking time at 4.5 km/h to 8 service categories; points fall as the walk gets longer. No street quality described | Whatever you define |
| Public method | Yes, on our method page | Yes, on its methodology page | Yes, on its project page | Your own |
| Published tests | Census checks in France, England and Wales, and Ireland, with the failed checks published | Outside studies listed on its research page, from North America in what we read; its own pages describe no European test (14 Oct 2026) | None described on its page | Yours to run |
| Licence | Scores and map data under the ODbL: use and share with credit. Service terms agreed per customer | API terms: storing scores and showing them elsewhere needs written approval or a paid plan; you cannot pass the right on to others | CC BY-NC-SA 4.0, a Creative Commons licence on its Zenodo record: non-commercial use only; what you build from it must carry the same licence | ODbL: use and share with credit; a database you publish must carry the same licence |
| How you buy | Write with your number of sites; files, API access, reports, rankings | Free plan for free consumer apps, 5,000 calls a day; Premium from $115 a month, quoted per site; spreadsheets on request | Download at no cost | Free map data; your own engineering time |
Read from each provider's own pages on 14 Oct 2026. If something has changed, write to us and we correct it.
Before you rely on the figures
Three things to check before the file goes into an application or a brochure.
Check with the certificate body first
DGNB and BREEAM set their own evidence rules. Use our figures as supporting evidence and show the file to the body that awards the certificate before you submit.
What the file does not include
How often buses or trains run. The file gives the walking minutes to public transport only.
OpenStreetMap completeness
A 2021 study of retail stores in two German federal states judged the average completeness high. By district, it ranged from 42% to 100%. Scores built on OpenStreetMap, including ours, depend on how complete the map is. Our published checks show how well the score matches census data on walking to work in three countries, and the checks that failed.
Questions buyers ask
Can you score our own list of plots of land?
Yes. Send us your list of addresses or areas. For each one, we return the score and the walking minutes to eight daily needs, plus the street-quality parts. You receive them in a file.
Which countries do you cover?
Walkably covers 31 European countries. You'll find the full list just below.
- Andorra
- Austria
- Belgium
- Bulgaria
- Croatia
- Cyprus
- Czechia
- Denmark
- Estonia
- Finland
- France
- Germany
- Greece
- Hungary
- Iceland
- Ireland
- Italy
- Latvia
- Liechtenstein
- Lithuania
- Luxembourg
- the Netherlands
- Norway
- Poland
- Portugal
- Slovakia
- Slovenia
- Spain
- Sweden
- Switzerland
- the United Kingdom
What does it cost?
There aren't public prices. We quote per customer by the number of sites. When you write, state your target countries and the number of sites. Also tell us what the figures are for.
Is our list of sites kept confidential?
Your list is used to produce your file. If your list is confidential, tell us in your email. We'll confirm in writing how we handle it before you send the full list.
Can we use the figures in brochures and reports?
Yes. You can use the scores in brochures and reports, including commercial projects. You get the scores and map data under an open database licence called the ODbL. You just give credit, and keep the same licence if you change the data. Our written agreement covers our service: scoring your sites and delivering the file.
Will DGNB or BREEAM accept the figures?
DGNB and BREEAM set their own evidence rules. DGNB measures distance in a straight line unless a barrier forces a real path. BREEAM also needs how often buses or trains run. We don't supply that information. A walk on real streets is never shorter than a straight line. Show the file to the body that awards the certificate before you submit the application.
Why do your minutes differ from a phone route planner?
We walk on real streets at a fixed 80 metres a minute. We start from the 55 m cell that holds the address, not from the building entrance. Route planners use their own speeds and start points. Because of those differences, their minutes can differ.
What if a plot has no address?
Send the area instead. We score every 55 m cell with a street. Because of that grid, we score an area as easily as an address.
Is OpenStreetMap complete enough?
OpenStreetMap is a free world map built by volunteers, and completeness varies by area. A 2021 study of retail stores in two German federal states judged average completeness high. By district, it ranged from 42% to 100%. Our checks test the score against census data. They don't count missing shops.
Does ESG reporting ask for walking figures?
ESG reporting (reports on environmental, social and governance topics) doesn't always ask. GRESB is a yearly sustainability survey of property funds. Its 2025 real estate indicator summary lists no walking or transport-distance indicator. Where your framework asks for walking distance to public transport, that figure is in the file. It's there for every address in the 31 countries.
Does the score replace a market study or a site visit?
No. The score measures access on foot and the quality of the street. It doesn't say anything about land prices or demand. Your team gets one more measured fact to compare plots with.
Do walkable sites sell or rent for more?
We don't make that claim. Use the figures for what they measure: access on foot, and the proof that certificate bodies and buyers ask for.
Who makes Walkably?
Walkably is made by Raian Pollock. The method page explains the score and underlying data, as well as the checks. It also gives the contact address.
Coming soon
- District rankings like Hamburg's for more cities.
- A population and age layer showing who lives within walking distance.
- Coverage for more countries beyond the 31.
Send us your list of sites
Email [email protected] with your list of addresses or areas and the countries. Add the number of sites and how you plan to use the figures. That can be choosing plots, a certificate file, a mobility concept or a brochure. There aren't public prices, so include the number of sites. We score every site with the same method in all 31 countries and send you the file. API access is arranged per customer.
[email protected]Try it first
Check one of your sites free on the live map.
You run a property websiteYou advise developers on site workAll offers for companies and public bodies