 Walkably
15-minute city data for cities and regions
See which parts of your city reach shops, doctors, schools and public transport on foot, and which streets are good to walk along. Each 55 m cell with a street gets three separate things: a score from 0 to 100, the walking minutes to eight daily needs and a street-quality rating.
- 31European countries, one method
- A score for every 55 m cell with a street, towns included
- 477city pages for cities of about 100,000 people or more
- Checks against census data, and the checks that failed, all published
What planning documents show about today's tools
Council planning reports, contract notices and plans describe these problems. The first item is a direct quote. The others draw on the linked sources.
A tool that “does not account for the quality or safety of a route”
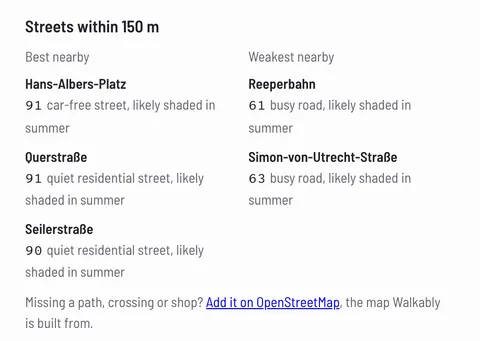
Oxfordshire County Council wrote in May 2026 that the Department for Transport Connectivity Tool for England and Wales “does not account for the quality or safety of a route from a site to potential destinations”. The council used the tool to score 28 potential development sites for West Oxfordshire's Local Plan (the land-use plan of an English council). It also noted that the tool does not account for the barrier made by the A40 main road. A short distance on paper can mean a walk along a busy road without shade. Walkably rates the street itself: traffic, noise, summer shade, busy roads and slope make up 40% of every score. If street quality is under 40, the score stays at 69 or lower. Walkably doesn't rate crossings or collisions. For each site, you see these parts beside the walking minutes.
You can show a committee the road and the street quality next to the reach, for every site.
Check score factors and set custom weights
In Leeds, a 20-minute neighbourhood study by Mott MacDonald for Leeds City Council included 28 kinds of place, such as shops. The weights came from workshops with local groups and a public survey. The consultants then spot-checked what drove single scores. Walkably shows the parts behind every score for each 55 m cell: the minutes for each need and each street-quality part. Because you get the minutes for each need, your team can apply its own weights.
Your team can check any score against what it knows about the street, and weight the needs its own way.
15-minute goals are set, but measurement is often missing
Paris proposed a 'quartier du quart d'heure' guideline in its 2022 draft Local Urban Plan. Utrecht presented a 'tien-minutenstad' strategy for 2040 to its council. Goals like these need the walking minutes for every district, measured the same way across the whole city. Walkably gives the minutes from every cell to eight daily needs, so you measure the goal district by district.
Measure a 15- or 20-minute goal with one method for every district.
Compare cities across borders using one method
National tools like the Department for Transport Connectivity Tool cover only the area they were built for. Comparing your city with a city abroad needs a second method. A study bought from a consultancy answers one question on one date. One published notice shows what such a study costs: Leeds City Council awarded its 20-minute neighbourhood assessment for about £19,700 in 2022. Walkably uses one method across 31 countries and delivers the scores as files for your GIS (map software).
Compare your city with cities abroad using the same numbers.
Sample output: 93 Hamburg districts, ranked
Here's the public version of what a city receives. It ranks 93 of Hamburg's 104 official districts by walkability. The other 11 have too few buildings to rank and are listed without a score. The page has a map, a sortable table and a CSV download (a plain table file that opens in Excel). You can also place the table on your own web page. It exists in German and in English.
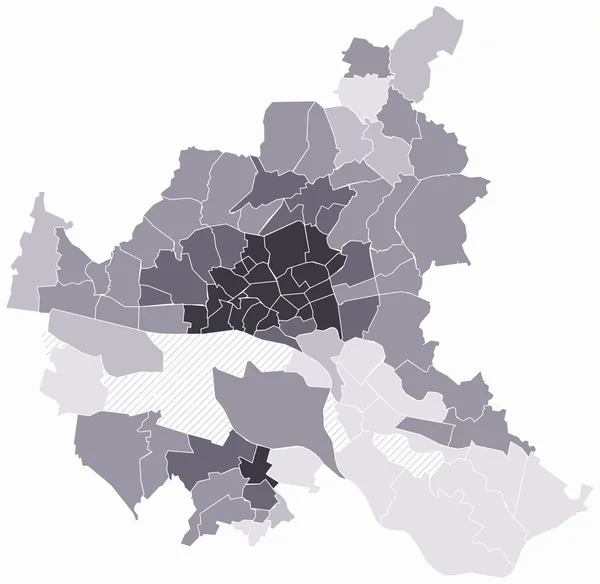
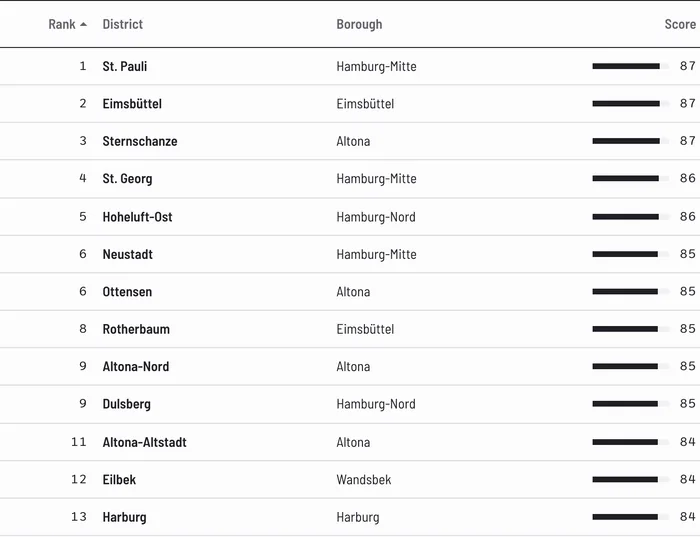
Map and sortable table
Every ranked district has a score from 0 to 100 and its place in the ranking. The map and the table show the same numbers.
CSV download
The same ranking as a CSV file for your GIS or spreadsheet. Join it to your own district boundaries and map it in your own style.
A table for your own web page
Place the ranking on your own web page, in German or English. Residents and councillors see the same numbers your planners use.
The same ranking for your city, on request
We make the same ranking for your city on request, for example every district. Email us how many districts you need; we confirm the date when you ask.
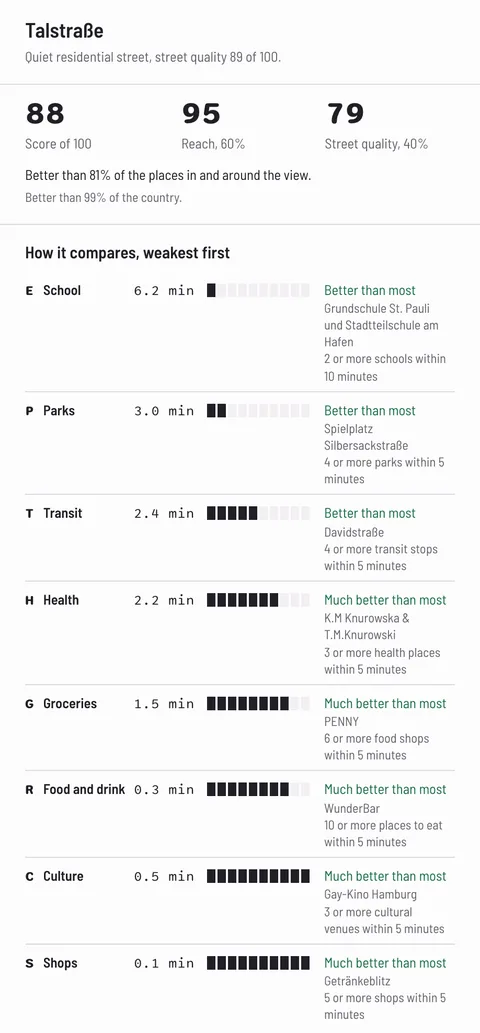
What you receive: scores and walking minutes
For each 55 m cell with a street, you get three things, each a number your team can check. Then you choose how it is delivered.
A walkability score from 0 to 100
Reach counts 60%: the walking minutes on real streets to eight daily needs. Street quality counts 40%. If street quality is under 40, the score stays at 69 or lower, however many shops are close.
Walking minutes to each of eight daily needs
Groceries, food and drink, shops, health, school, parks, culture and public transport. You choose which of the eight needs to count and which target to apply, such as 15 or 20 minutes.
The street-quality parts
Traffic, noise where your city publishes noise maps, summer shade, busy roads and slope. Each part is shown on its own, so you see why a street scores low. Summer shade is shown as an estimate; see the checks below.
Delivered the way your team works
Scores for your districts, sites or address lists as files for your GIS, on request. A ranking page like Hamburg's for your city on request; we confirm the date when you ask. Area and city reports, written for you on request. A data connection for your own software (API), arranged per customer. Updates and support are part of the service.
How to order
You name the area and the decision the data must support: Local Plan sites, a 20-minute neighbourhood check, a mobility plan. Every 55 m cell with a street in that area gets a score, the minutes per need and the street-quality parts. We summarise them per district or site. You receive the files, the ranking page or the report.
Why you can trust the score
OpenStreetMap, the free map made by volunteers, is open, so you may ask how reliable a score built on it is. This is how we check it. We publish the checks that failed as well as the ones that passed, so you know the limits before you use the data.
| Check | Agreement | Agreement | Pass mark | Result |
|---|---|---|---|---|
| France, neighbourhoodsINSEE census 2021, walk to work; middle city of 28 | 0.73 | 0.35 | Pass | |
| Ireland, neighbourhoodsCSO census 2022; middle of 34 counties and cities | 0.68 | 0.35 | Pass | |
| England and Wales, neighbourhoodsONS Census 2021; middle of 301 council areas | 0.62 | 0.35 | Pass | |
| Busy roadsStreet audit of 43 European city centres (Bartzokas-Tsiompras and Photis, 2021) | 0.56 | 0.40 | Pass | |
| Cities against citiesEurostat city walking shares, 195 cities in the first 20 countries on the map | −0.04 (0.43 for walk or public transport) | 0.50 | Fail | |
| Summer shadeTree cover in the same 43 city centres | −0.18 (0.27 for trees alone) | 0.40 | Fail | |
| Ten US cities, run only to test the methodAmerican Community Survey 2020 to 2024, about 3,000 small census areas | 0.34 | 0.35 | Fail, narrowly |
Agreement is a rank correlation between our scores and the comparison data, from -1 to 1. For the census checks it is the typical value: the middle city of each country. A negative number means the two orders run in opposite directions. The 0.35 pass mark for the census checks was set before any result. Paris alone is at 0.18. Full tables and method on /about#checks.
The method on one screen
Reach counts 60%, street quality counts 40%, and a cap at 69 applies when streets score under 40. The full method, every data source and every weight are on the About page.
Checked against census data, neighbourhood by neighbourhood
We compared our scores with census figures on how many people walk to work, in France, in England and Wales, and in Ireland. The pass mark for these checks, 0.35, was set before we saw any result. Typical agreement, the middle city of each country, was 0.73 in France, 0.62 in England and Wales and 0.68 in Ireland. Agreement is a rank correlation from -1 to 1: at 1 the two orders are the same, at 0 there's no link. Paris alone is at 0.18; the About page explains why.
Three countries passed a mark set in advance
The checks that failed, published
Three checks failed. City-level walking shares from Eurostat, across 195 cities, gave -0.04 against a pass mark of 0.50. Summer shade, compared with a published street-view audit of tree cover in 43 city centres, gave -0.18 against a pass mark of 0.40. A third check, a test of the method in the ten largest US cities, gave 0.34 against a pass mark of 0.35, so it failed narrowly. A negative number means the two orders run in opposite directions. Shade is one of the five street-quality parts, so the map shows summer shade as an estimate and says so. Every result stays on the About page with the method behind it.
You know the limits before you use the data
Built on map data you can check
Walkably is built from public data, mostly from OpenStreetMap. Our scores and that map data are under the ODbL, an open database licence. Anyone may use and share them with credit. Where OpenStreetMap misses a shop or a clinic, so do we. Your team can check single places on the free map against what it knows.
How Walkably compares with the free Europe map
Checked against each provider's own pages and terms on 14 Oct 2026, except where a cell says otherwise. Where Walkably is weaker, the row says so. Sources are listed on the 'How we compared' page, linked under the table.
| - | Walkably | 15-Minute City Score Europe Map | Build it yourself from OpenStreetMap |
|---|---|---|---|
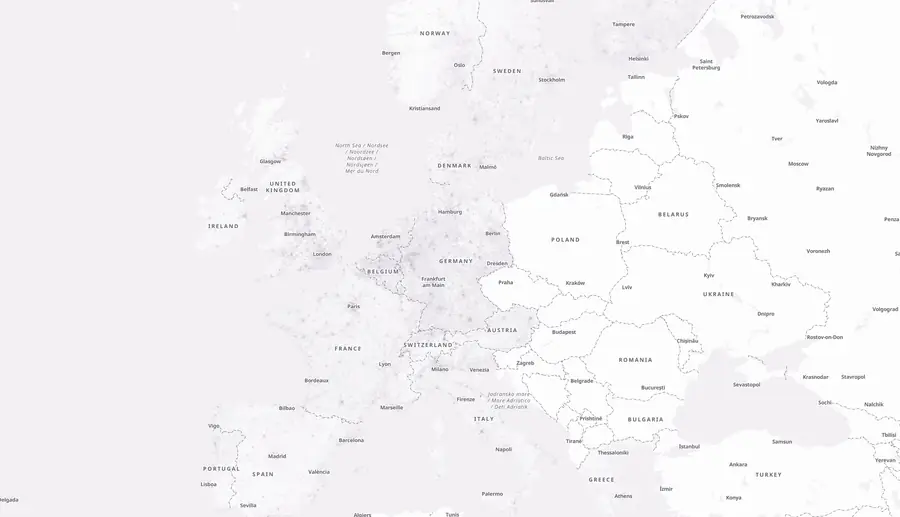
| Europe coverage | 31 countries; every 55 m cell with a street, towns included | 786 urban areas above 50,000 people, across Europe | All of Europe; the map data extract is 32.8 GB |
| What it measures | Walking minutes to 8 daily needs, plus street quality: traffic, noise, shade, busy roads, slope | Walking access to 8 service types per hexagon of about 0.1 km² | Whatever you define and build |
| Method public | Yes, on /about | Yes | Your own |
| Published checks against real data | Yes, including the failed checks, on /about#checks | None described on its page | Your own |
| Licence | Scores and map data: ODbL, an open database licence, use and share with credit. Service: terms agreed per customer | CC BY-NC-SA 4.0 for the dataset: non-commercial use only, and what you build from it must be shared on the same terms. Check that your use fits | ODbL: a database you make from the data and publish must be shared on the same terms |
| How you buy | Write by email with the number of districts, sites or addresses; no public price list | Free download | Free data; weeks to months of engineering (our estimate) |
The same OpenStreetMap gaps apply to all three: a 2021 study of shops in two German states found completeness between 42% and 100% by district. ODbL covers Walkably's scores and the map data behind them; the service around them (your areas scored, files, updates, support) is agreed per customer.
Where Walkably adds to the free Europe map
The 15-Minute City Score Europe Map is a good free resource and, like Walkably, it's built on OpenStreetMap. Walkably uses cells of 55 m; the Europe map uses hexagons of about 0.1 km². Walkably covers every town with a street, while the Europe map covers urban areas above 50,000 people. Walkably adds a street-quality rating and published checks against census data.
Where Walkably is weaker
There's no public price list; email us the number of districts, sites or addresses. Our checks are our own, not peer-reviewed studies. Walkably shares the OpenStreetMap gaps of every tool built on it: where a shop isn't mapped, it isn't counted.
Questions from planning and procurement teams
Short answers to the questions we hear from city and regional bodies. Write to [email protected] for anything not covered.
We already have a GIS team and software. What does Walkably add?
A finished layer, not another tool. You receive scores, walking minutes and street-quality parts as files and load them into QGIS, ArcGIS or any GIS you use. Your team spends its time on the planning question, not on building and testing a walkability model from OpenStreetMap.
Do you need personal data?
A district ranking is built from your official district boundaries and our scores. For scores on your own addresses or areas, you send that list. Ask us about processing location and data agreements before you order.
What does the licence let us do with the scores?
Walkably's scores and the map data behind them, mostly from OpenStreetMap, are under the ODbL, an open database licence. Anyone may use and share them with credit, inside your GIS, in a published plan or on a public map. A changed version of the database that you share stays under the ODbL. What you buy is the service: your areas scored, files in your format, updates and support, with terms agreed per customer.
How do we buy, and what does it cost?
There's no public price list. The price depends on the size of the area and what you need: files, a ranking page, a report, a data connection, updates. Email us the number of districts, sites or addresses to [email protected], and you receive a price for the area and work you describe. Your own procurement rules decide the procedure, for example a quotation or a direct award.
What if we can only buy from approved suppliers?
Consultancies can buy the same data as cities. Share our page for urban planning consultancies with a supplier on your list and ask whether it can include the data in its offer.
Does Walkably tell us whether a district meets a 15-minute goal?
No. We give the walking minutes from every cell to each of eight needs. You choose which of the eight needs to count and which target to apply, such as 15 or 20 minutes. We don't set or certify a goal.
What if the score is wrong for a street we know?
Open the cell on the free map and read the parts: minutes per need and each street-quality part. Often the cause is a missing shop or clinic in OpenStreetMap, which anyone can correct. Our published checks on the About page, including the ones that failed, show where the method is strong and where it is not.
Do you cover towns under 100,000 people and rural areas?
Yes. Every 55 m cell with a street in the 31 countries has a score. The 477 city pages cover cities of about 100,000 people or more. For a smaller town or a whole region, ask for a custom area.
Who is behind Walkably, and who answers when something breaks?
Walkably is made by Raian Pollock, who answers [email protected]. Support and updates are part of the service. The method is published and the map data is open.
Coming soon for cities and regions
- District rankings like Hamburg's for more cities.
- A population and age layer.
- City pages in more local languages.
- More countries beyond the 31.
Request data for your city
Email [email protected] with your city or region, the decision the data must support and the number of districts, sites or addresses. You get an answer on what we can deliver for your area and what it costs.
[email protected]Request a ranking for your city
One email with your area and the number of districts, sites or addresses is enough to start.
Try it first, free
Check single places on the live map, or open the Hamburg district ranking to see the full output.
Compare with 477 cities
Every city of about 100,000 people or more has a page. It shows the typical score, the areas best and least served by daily needs on foot and the rank in the country. One method across 31 countries, so the numbers compare.
Other buyers
Advisers to cities: see the page for urban planning consultancies. All buyer types: Walkably for business.