 Walkably
Walkability data for consultancies
One method for the walking part of every study in 31 European countries. Minutes on foot to eight daily needs and a street-quality score for each 55-metre street cell. Built for planners and real estate advisers who put walking numbers in client reports.
- 31European countries
- 477city pages
- A score for every 55-metre street cell
- Minutes on real streets to 8 daily needs
- Public method checked against census data in 3 countries, with failed checks published
Stop rebuilding walking analysis for each study
Clients ask for walking strategies or site location reports. The walking part needs minutes on real streets to daily needs for thousands of locations. Many teams build it again for each project.
Built once per project
A common method draws 15-minute walking areas in map software such as QGIS, using OpenStreetMap roads. It then merges them with a population grid. That works for one area. The next study in another region or country needs the same work again.
Fixed fees leave little time for base data
Two public English tenders we found: about £43,000 in 2022 and £79,500 in 2024, each for a whole walking and cycling plan. Time spent on base data is time not spent on advice.
One dataset, three disciplines
Choose your discipline. Each tab shows what you deliver to clients and how our data feeds it.
Urban planning
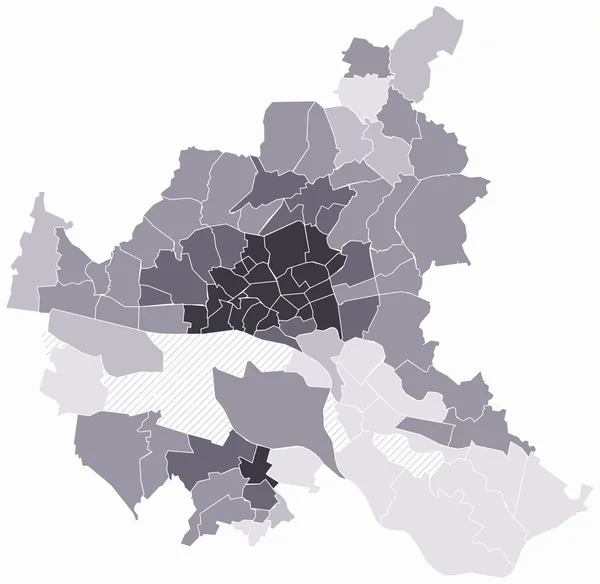
You deliver walking strategies, 15-minute neighbourhood studies, and local plans. You also prepare sustainable urban mobility plans (SUMPs). The EU's revised TEN-T rules govern its main transport network, asking 431 cities to adopt a SUMP. Member States must submit urban mobility indicators by 31 December 2027. Our data gives you a score for each 55-metre cell in the municipality. For cities of about 100,000 people or more, the city page adds typical scores and the areas best and least served by daily needs on foot. Minutes per need show which streets sit over 15 minutes on foot from groceries, a school, or a park. Count residents with your own population data. Street-quality factors show if the issue is distance or the street itself: traffic, noise, shade, busy roads, or slope. Hamburg's official districts are ranked and published; for your city we make the same ranking on request, and we confirm the date when you ask.
A map of the streets that miss the 15-minute mark and a custom ranking of your districts. One method, reused in the next city.
Transport planning
You deliver walking and cycling infrastructure plans (LCWIPs in England) and pedestrian audits. You also deliver the walking part of an accessibility analysis (Erreichbarkeitsanalyse in Germany). Mobility plans need walking and cycling indicators. You provide them. Routes follow real streets. Our data gives you walking minutes, not straight lines. Times run from every cell to public transport stops and seven other needs. The traffic and busy-roads parts mark cells on or beside busy roads. The same measure applies across all 31 countries. One method serves a region or cross-border study.
A consistent walking baseline for every cell, ready before the first site walk.
Real estate advisory
You deliver location reports and evidence for building certificates. In German practice, this report is the Mikrolage, meaning the site's immediate surroundings. BREEAM (a UK building certificate) and DGNB (its German counterpart) both ask for distances to amenities. BREEAM International 2016, Tra 02, measures them along safe walking routes. DGNB SITE 1.4 (version 2020) mostly uses a straight-line radius. We cover any site. Our data gives you the score and the street-quality parts. You also get minutes on foot to eight daily needs. Delivery is by file or API. Walking times assume 80 metres a minute on real streets, so 500 metres is about 6 minutes. The 477 city pages cover cities of about 100,000 people or more. Each gives the typical score and national rank. This compares an asset to its city, and the city to its country. The numbers support your evidence documents, while the assessor still checks the site plan.
A location section with checkable numbers for every asset, using the same method in every covered country.
See real output before you write to us
The live map and the Hamburg district pages show the product as it is. No forms and no demo calls.
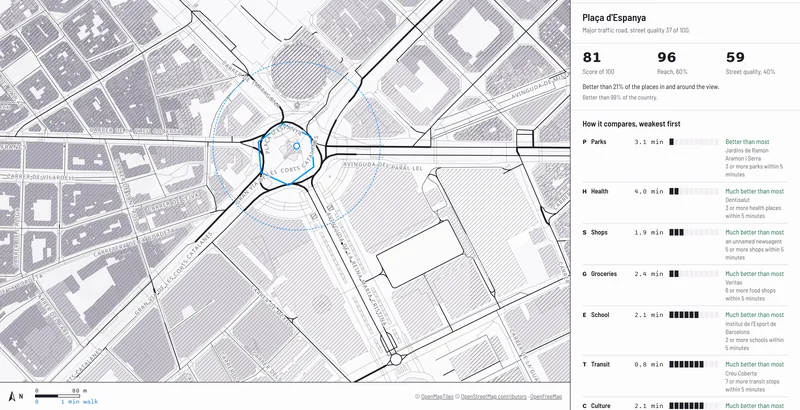
One spot
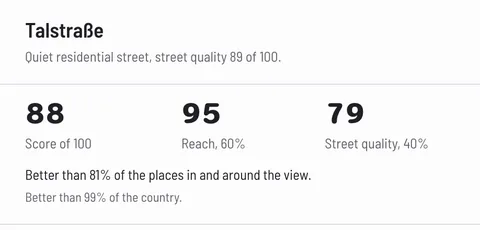
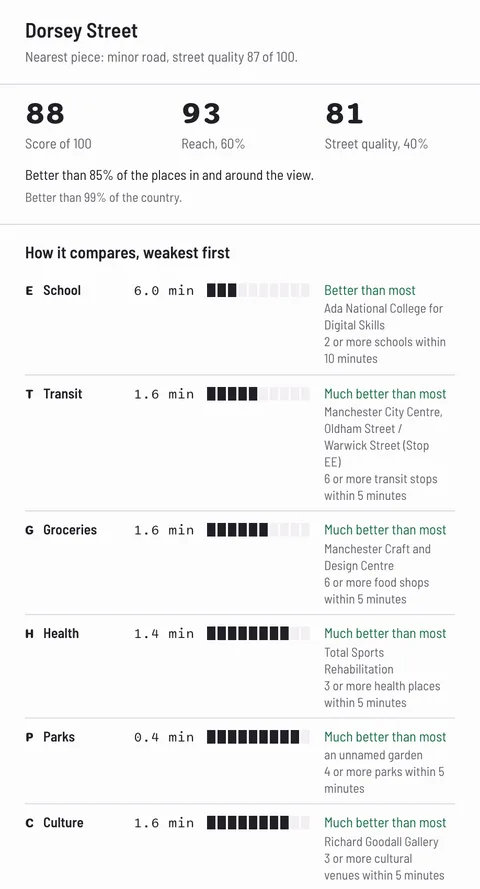
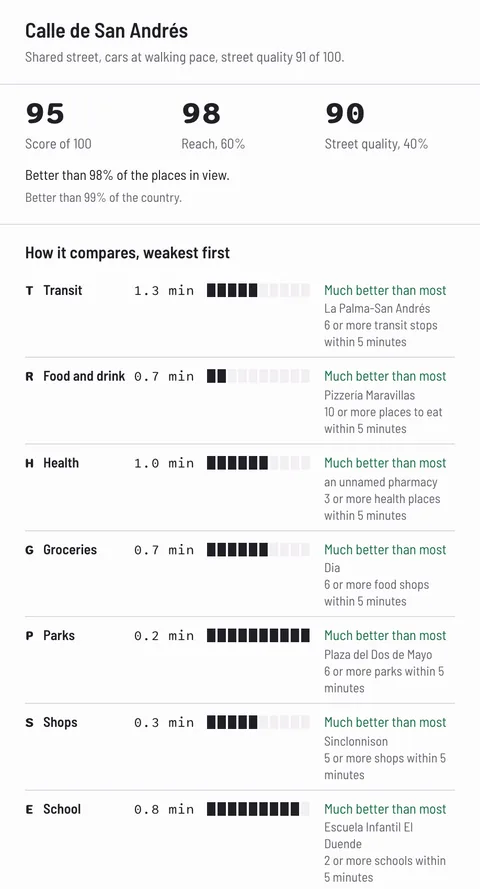
Click any street on the map. You see the score and street-quality parts. You also see minutes on foot to eight daily needs. Noise appears only where the city publishes noise maps. Single checks are free for anyone.
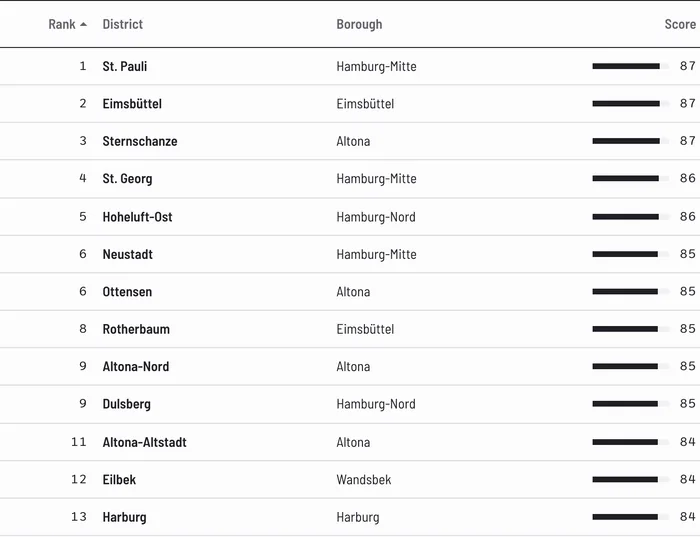
One city, ranked by district
Hamburg has 93 of its 104 official districts ranked. The page has a map, a sortable table and a CSV download (a spreadsheet file). You can also embed the table in your own page. The page is in German and in English. We rank districts for your city on request; we confirm the date when you ask.
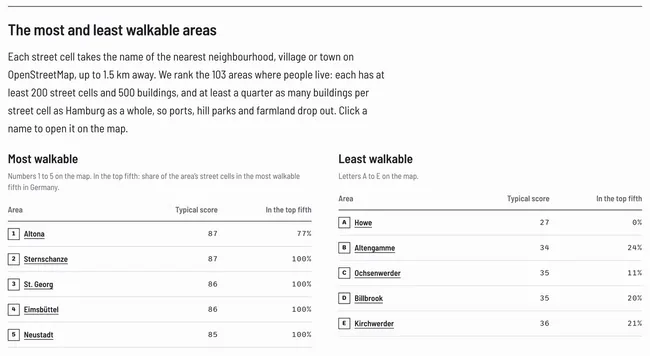
477 cities
Every city of about 100,000 people or more has a page. It shows the typical score and national rank. It also shows the areas best and least served by daily needs on foot.
What you receive
You get the same fields the map shows, in bulk for your addresses or areas. Here is a real example. These are Hamburg's typical values from its city page.
| Field | Hamburg, typical value | What it means |
|---|---|---|
| Walkability score | 67.3 | 0 to 100 for each 55-metre street cell; here the typical value across Hamburg |
| Minutes to groceries | 6.7 | Walking minutes on real streets to the nearest grocery shop |
| Minutes to food and drink | 5.7 | Nearest cafe, bar, or restaurant |
| Minutes to shops | 5.1 | Nearest other shop |
| Minutes to health | 7.1 | Nearest doctor, pharmacy, or clinic |
| Minutes to school | 5.4 | Nearest school |
| Minutes to parks | 3.0 | Nearest park or green space |
| Minutes to culture | 7.9 | Nearest library, theatre, museum, or similar venue |
| Minutes to public transport | 3.4 | Nearest stop or station |
| Street-quality parts | shown per spot | Traffic, noise where the city publishes noise maps, summer shade, busy roads, slope; omitted in this city-level summary |
Minutes are walking minutes on real streets, at 80 metres a minute. Reach is 60% of the score. Street quality is 40%. If street quality is under 40, the score stays at 69 or lower. Tell us the file format your GIS software needs.
Files for your addresses or areas
We do this on request. Send a list of addresses or draw the areas. You get the fields above for each one. Updates are agreed with you.
API access
Arranged per customer, for an internal tool or a client product.
Area and city reports, written for you on request
A report for one area or one city, written for you on request. It shows the score, the minutes per need and the street-quality parts.
Custom rankings
We rank every district of a city of your choice, as on the Hamburg page. We make it on request; we confirm the date when you ask.
Why you can show the score to a client
The score has a public method and published checks, including the ones that did not pass. Walkably is made by Raian Pollock.
| Check | Agreement | Agreement | Pass mark | Result |
|---|---|---|---|---|
| France, neighbourhoodsINSEE census 2021, walk to work; middle city of 28 | 0.73 | 0.35 | Pass | |
| Ireland, neighbourhoodsCSO census 2022; middle of 34 counties and cities | 0.68 | 0.35 | Pass | |
| England and Wales, neighbourhoodsONS Census 2021; middle of 301 council areas | 0.62 | 0.35 | Pass | |
| Busy roadsStreet audit of 43 European city centres (Bartzokas-Tsiompras and Photis, 2021) | 0.56 | 0.40 | Pass | |
| Cities against citiesEurostat city walking shares, 195 cities in the first 20 countries on the map | −0.04 (0.43 for walk or public transport) | 0.50 | Fail | |
| Summer shadeTree cover in the same 43 city centres | −0.18 (0.27 for trees alone) | 0.40 | Fail | |
| Ten US cities, run only to test the methodAmerican Community Survey 2020 to 2024, about 3,000 small census areas | 0.34 | 0.35 | Fail, narrowly |
Agreement is a correlation from -1 to 1. A value of 1 means both rank places in the same order. 0 means no link. Below 0 means the opposite order. In plain terms, neighbourhoods we score high are mostly where more people walk to work. Pass marks are ours, not an industry standard. Full tables are at /about#checks.
The method in short
Reach is 60%: walking minutes on real streets to eight daily needs. Street quality is 40%: traffic, noise where a city publishes noise maps, summer shade, busy roads, and slope. If street quality is under 40, the score stays at 69 or lower.
Open licence
Walkably is built from public data, mostly OpenStreetMap. The scores and the map data are under the ODbL open licence: anyone may use and share them with credit to OpenStreetMap contributors. You pay for the service around the data, not for a right to use it.
Checked against census data
We compared scores with census data on walking to work by neighbourhood in France, England and Wales, and Ireland. All three passed a pass mark set before receiving results. These checks are ours and published in full. They are not peer-reviewed.
What didn't pass
City-level walking shares from Eurostat, the summer shade part, and a method test in ten US cities didn't pass. All are published beside the passes. Summer shade remains in the score as an estimate from building heights and tree maps. The map labels it as an estimate, and delivered files should be read the same way.
Who made it
Walkably is made by Raian Pollock. The About page names every data source and the licence of each.
How Walkably compares with your current tools
Facts a buyer would check, read from each provider's pages on 14 October 2026. As of that date, we found no other commercial product offering a walking-time score across Europe.
| - | Walkably | 15-Minute City Score Europe Map (Transform Transport) | Walk Score Professional | Build it yourself on OpenStreetMap |
|---|---|---|---|---|
| Europe coverage | 31 countries, every 55-metre cell with a street, towns included | 786 functional urban areas (towns plus their commuter belt) above 50,000 inhabitants, across Europe | Official pages list the US and Canada; the public site shows scores for some European streets labelled Unsupported Country | Any area in the 32.8 GB Europe download |
| What is measured | Minutes on real streets to 8 needs (60%) plus street quality: traffic, noise, shade, busy roads, slope (40%) | Walking areas at 4.5 km/h to 8 service categories, in hexagons about 174 metres on each side, scaled 0 to 100 | Walking distance to amenities, with fewer points as distance grows, plus block length and intersection density; separate transit and bike scores | Whatever you build: free routing software plus your own categories and weights |
| Method public | Yes, on /about | Yes, on the project page | Yes, methodology page | Yours |
| Published validation | Census checks for France, England and Wales, Ireland; checks that did not pass are published; self-published, not peer-reviewed | No validation step described | One peer-reviewed study in four US metro areas found moderate links with GIS measures; we found none for Europe | Yours to do |
| Licence and storing results | Scores and map data under ODbL: credit required; a database built from them must use the same licence; service terms agreed per customer | CC BY-NC-SA 4.0 on Zenodo (a public research data site): no commercial use; a work built on it must use the same licence | Storing results only with written approval or the Premium plan; display only on a freely accessible site the licensee owns; you cannot pass the right on to others | ODbL: credit required; a database built from it must use the same licence |
| How you buy | Write with your volume; no public price list; files, reports, custom rankings, API arranged per customer | Download on Zenodo | Free plan: 5,000 calls a day for free consumer apps; Premium from $115 a month, quoted per site; data services as spreadsheets or API, price on request | Free software and data; the cost is your engineering time and your own completeness checks |
A paid client report is commercial use, so read the licence row first. Sources are listed at the end of the page. If a row is out of date, write to [email protected] and we correct it.
Against the free Europe map
The 15-Minute City Score is free and also built on OpenStreetMap. We add finer six-sided cells (sides of 55 metres, against hexagons about 174 metres on each side) and street quality. We also cover towns below 50,000 people and publish checks against census data. You can use our scores in your own commercial work under the Open Database Licence (ODbL). The licence has two conditions: credit the source, and release any adapted version on the same terms. You pay for the service: scoring your own addresses or areas, and delivering the result by file or API.
Against building it yourself
Software and base data are free. The real cost is your engineering time and completeness checks. A 2021 study of shops in two German states found OpenStreetMap completeness varied from 42% to 100% across districts. That gap applies to our data too. Inspect your area on our free map before writing to us.
Questions buyers ask
Which countries do you cover?
31 European countries: Andorra, Austria, Belgium, Bulgaria, Croatia, Cyprus, Czechia, Denmark, Estonia, Finland, France, Germany, Greece, Hungary, Iceland, Ireland, Italy, Latvia, Liechtenstein, Lithuania, Luxembourg, Netherlands, Norway, Poland, Portugal, Slovakia, Slovenia, Spain, Sweden, Switzerland and the United Kingdom. Every 55-metre cell with a street is scored, in towns as well as cities.
Can you score our own list of addresses or our study area?
Yes, we do this on request. Send the list or the areas. You receive the score, the minutes on foot to each of the eight needs and the street-quality parts, as a file. Tell us the format you need. We can also rank every district of one city, as on the Hamburg page; we confirm the date when you ask.
How accurate is the score?
We compared scores with census data on walking to work by neighbourhood. France (0.73), England and Wales (0.62), and Ireland (0.68) passed a pass mark of 0.35 set before receiving results. Checks that didn't pass are published too: city-level walking shares from Eurostat (-0.04 against 0.50), summer shade (-0.18 against 0.40), and a method test in ten US cities (0.34 against 0.35). Census checks cover those three countries. For other countries, test your area on the free map before writing to us. All details are on /about#checks.
OpenStreetMap has gaps. Does that affect the score?
Yes. Our data relies mostly on OpenStreetMap, so where map coverage is thin, the score is less reliable. Towns with few mapped shops or footpaths are the likeliest gaps. Inspect your area for free on the live map before writing to us, and tell us if anything looks incorrect.
We can build this ourselves in QGIS or GOAT (free map and accessibility software). Why buy it?
You can build it for one area. Walkably gives you the same method for every street in 31 countries. All values are already computed. You get minutes per need alongside street-quality parts, backed by published checks including those that did not pass. Spend your project time on advice.
Can we use the numbers in reports for our clients?
Yes, you can also use them in a paid report. The scores and the map data are open under the ODbL, which allows commercial use with credit. Put this line in the report: Contains information from OpenStreetMap, © OpenStreetMap contributors, available under the ODbL. What we agree with you before delivery is the service: the areas, the file format, the date and support.
Does BREEAM or DGNB accept the score?
We found no walkability score named in BREEAM International 2016 (Tra 02) or in DGNB criteria version 2020 (SITE 1.4). Both ask for distances to amenities and an assessor-checked site plan. Our walking minutes per need support that evidence. They assume 80 metres a minute on real streets, so 500 metres is about 6 minutes. The assessor still completes the formal check.
What does it cost?
There are no public prices. Cost depends on your volume and the countries covered. It also depends on whether you need updates or API access. Write to [email protected] with your volume.
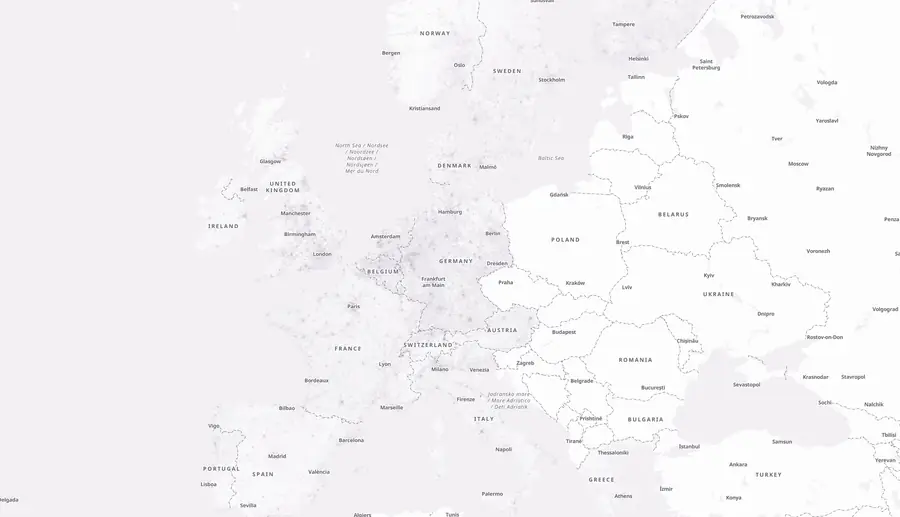
Coming soon to Walkably
- District rankings for more cities.
- A population and age layer.
- City pages in more local languages.
- More countries beyond the 31.
Request walkability data for your next study
Three steps. No portal and no demo call. 1. Write to [email protected] with your country or city and the number of addresses or areas. Add your intended use and the file format you need. 2. We agree the scope and deliver files, a report, a custom ranking, or API access. 3. You add the numbers to your report. Our method is public on the About page, so clients can see how each number was made. You can read the checks on /about#checks. See other use cases on /business: cities and governments, property developers and investors, real estate portals, and API access for software teams.
[email protected]Email your study area
Email [email protected]. One message with your place and volume is enough. Add your intended use and the file format you need.
Open the live map
Free single checks for any street in 31 countries.