 Walkably
Walkability data for business in Europe
See how daily life works on foot at any address in 31 European countries. You receive one score from 0 to 100, walking minutes to eight daily needs, and the quality of the streets behind both. Delivered on request as files for your addresses, by API (your software asks our server for a score), or as reports written for you.
- 31European countries
- 477city pages
- A score for every six-sided cell with sides of 55 metres that has a street
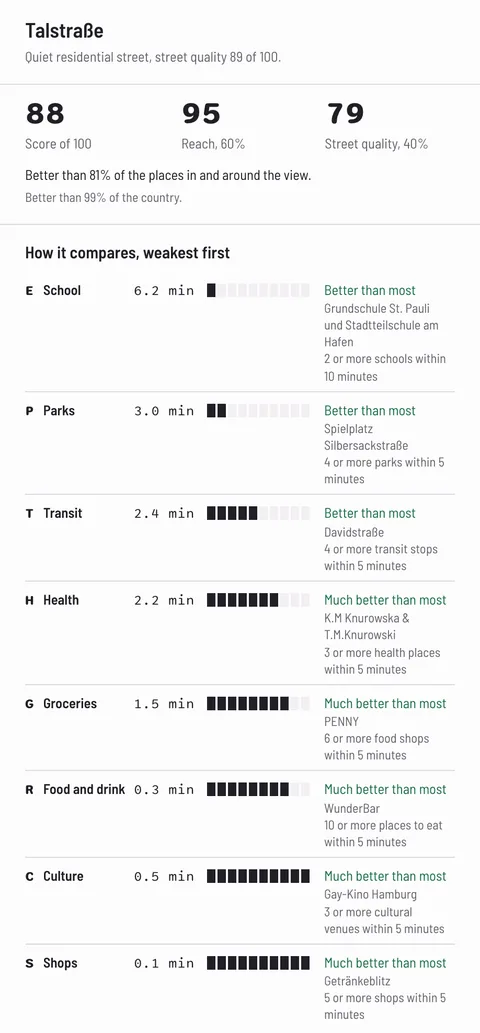
- Read from the live map, St. Pauli, Hamburg: score 88, groceries in 1.5 minutes, public transport in 2.4
Pick the page for your work
Each page shows what that team receives, alongside a sample of the output. It also answers likely buyer questions. Every page uses the same scores and the same method.
Property portals and listing sites
Add a location check to every listing: one score and the walking minutes to eight daily needs. Measured on real streets, not in a straight line. All 31 countries, one format.
Show how a place works on foot next to each listing.
Cities and regions
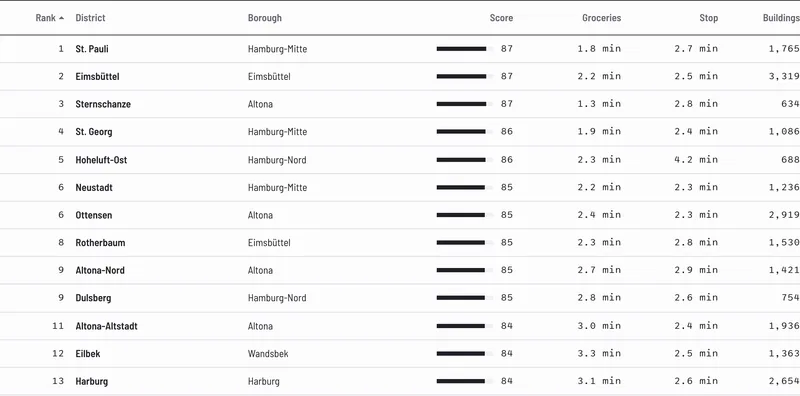
Rank every official district on daily needs and street quality, as the Hamburg page does. For your city we make it on request, and we confirm the date when you ask. See how your city compares with other European cities. These facts support a walking strategy or a sustainable urban mobility plan (SUMP). They also provide data for a 15-minute city plan, where daily needs are within a 15-minute walk.
Numbers for your walking plan that anyone can check.
Planning, transport and real estate consultancies
Start each study with ready walking data: minutes per need for each site, with its street quality. Use it for accessibility studies and investor reports. It also supports an LCWIP (a local walking and cycling plan in England). The data feeds the location part of BREEAM or DGNB assessments (building sustainability ratings); the assessor's own checks still apply.
Your team starts from the walking data instead of building it for each project.
Property developers and investors
Compare plots of land on what future residents can reach on foot. You get minutes per need for each site, for the location analysis (Standortanalyse, Mikrolage). Use these figures for site selection and sales material, or for applications to the city.
Numbers for the site decision and for the board that approves it.
{
  "sample": true,
  "score": 75,
  "reach": 82,
  "quality": 65,
  "minutes": {
    "groceries": 4,
    "food_and_drink": 3,
    "shops": 6,
    "health": 9,
    "school": 7,
    "parks": 5,
    "culture": 12,
    "public_transport": 2
  },
  "street_quality": {
    "traffic": 71,
    "noise": 54,
    "summer_shade": 58,
    "busy_roads": 66,
    "slope": 90
  }
}
Software teams
Get one score and eight walking times per spot by API (your software asks our server for the values). Your product needs no server of its own that calculates walking routes and no map data work. Access is arranged per customer.
Show how a place works on foot inside your product.
Research and public-interest groups
Compare any two places in Europe with one score, from 0 to 100, for every 55 m street cell. The score is tested against census data, and the failed tests are published. We send you the full data file; it is open to copy and cite with credit.
Data they can cite and check, with a public method.
Real output you can open today
These three things are live now, so you can open them today. Below them, see one spot read from the data behind the map.
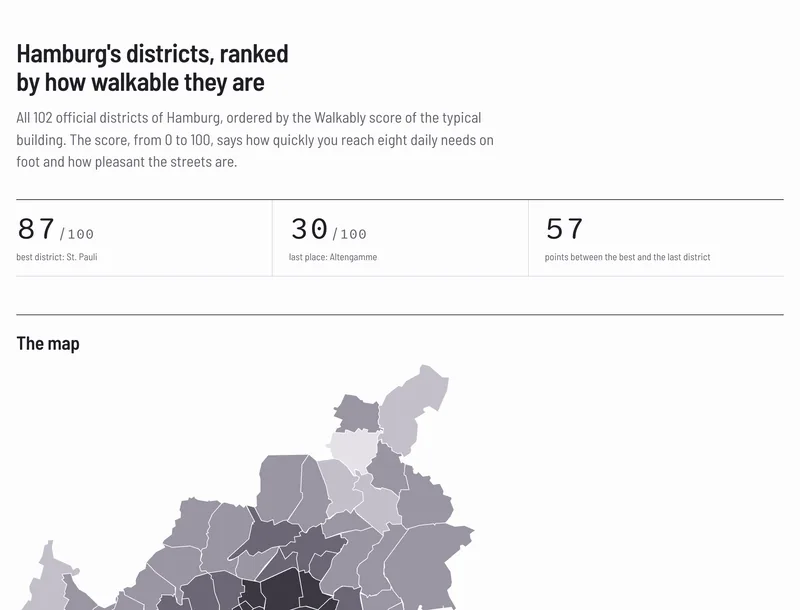
Hamburg district ranking
This ranks 93 of Hamburg's 104 official districts by score. The page includes a map and a table you can sort. You can also download a CSV file (a file that opens in any spreadsheet) or embed a table on your web page. We use this format for custom rankings.
In German: the Hamburg Stadtteile ranking at /city/de/hamburg/stadtteile/
477 city pages
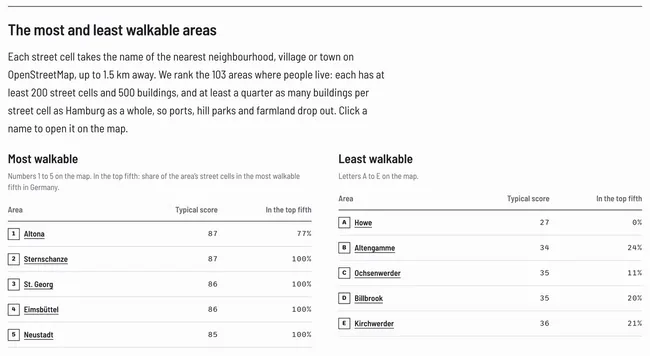
We provide pages for cities of about 100,000 people or more in the 31 countries. Each shows the typical score and the rank in the country. You can also see the areas best and least served by daily needs on foot.
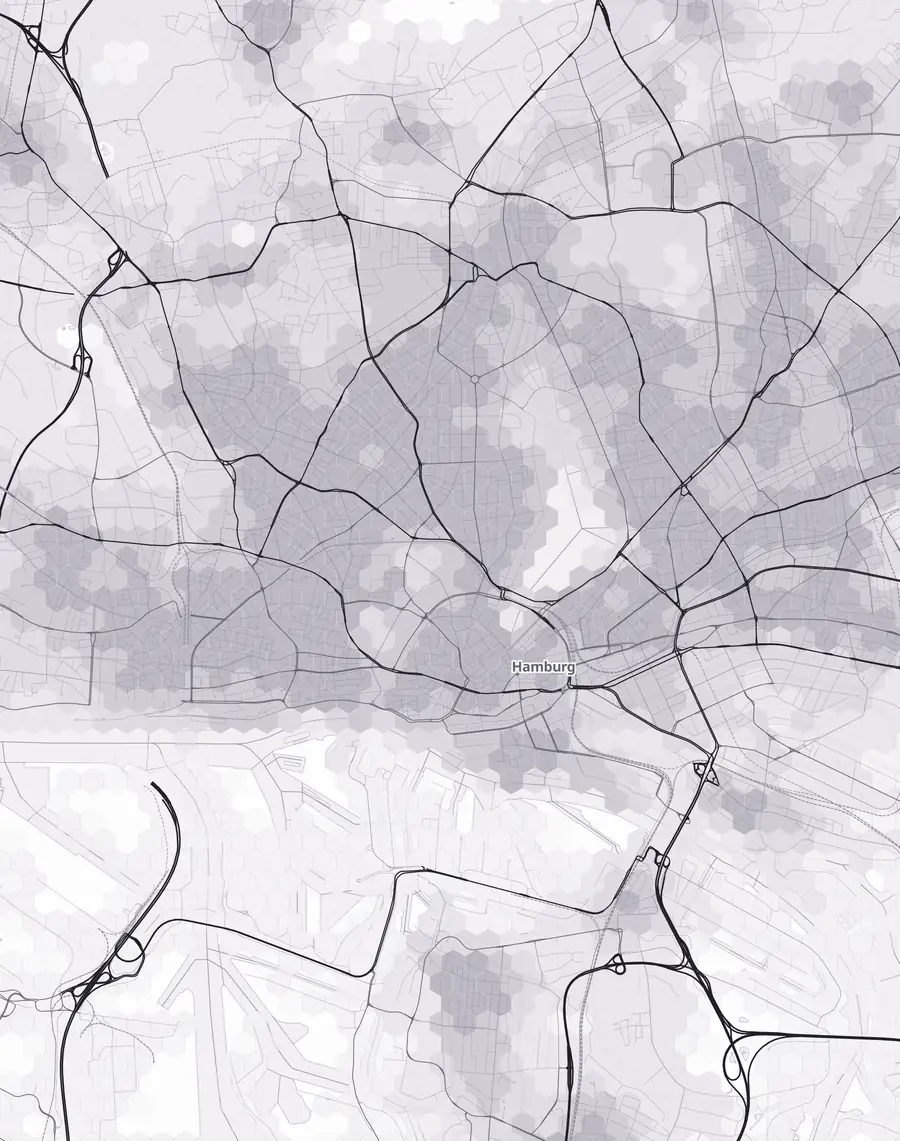
The live map
Click any spot with a street in the 31 countries to read its score and street quality. It also shows walking minutes to each need. Single checks are free for anyone.
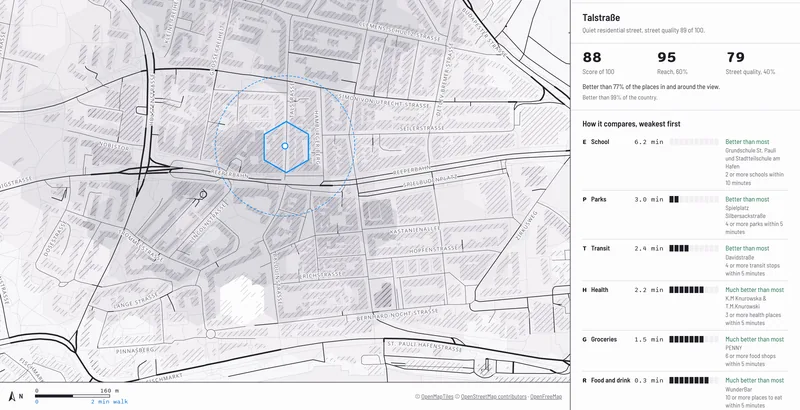
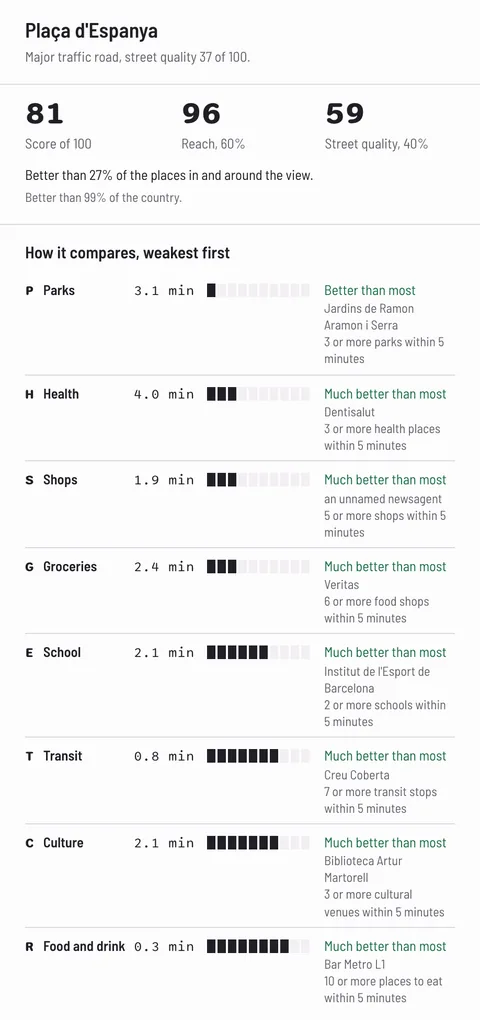
One spot, read from the live map
This is a cell in St. Pauli, Hamburg, at 53.5502 N, 9.9601 E. The map's panel at this spot shows the score and its two parts. It also shows the eight minutes; open the map there and click the spot. The street-quality parts in the table come from the same data behind the map.
Score 88 of 100: reach 95 (counts 60%), street quality 79 (counts 40%).
| Field | Value at this spot (St. Pauli, Hamburg) |
|---|---|
| Score, 0 to 100 | 88 |
| Reach, 60% of the score | 95 |
| Street quality, 40% of the score | 79 |
| Minutes on foot to the nearest groceries | 1.5 |
| Minutes to the nearest food and drink | 0.3 |
| Minutes to the nearest shop | 0.1 |
| Minutes to the nearest health service | 2.2 |
| Minutes to the nearest school | 6.2 |
| Minutes to the nearest park | 3.0 |
| Minutes to the nearest culture venue | 0.5 |
| Minutes to the nearest public transport stop | 2.4 |
| Traffic score | 80 of 100 (100 is calmest) |
| Summer shade | 75% of the street in shade |
| Busy roads within 50 m | 6% of the street |
| Slope | 2% |
| Noise | Not counted here: no city noise map for Hamburg is in the data |
Minutes are walking minutes on real streets to the nearest place of each kind. Street quality (79) is calculated from the parts over the streets around the cell.
What you receive for each address or area
The fields below come in files and by API access. Reports and rankings show them for the area.
| Field | What it tells you |
|---|---|
| Score, 0 to 100 | How well daily life works on foot at this spot. If street quality is under 40, the score stays at 69 or lower. |
| Reach, 60% of the score | How close the eight daily needs are on foot. |
| Minutes to each of 8 needs | Walking minutes on real streets to the nearest groceries, food and drink, shops, health, school, parks, culture and public transport. |
| Street quality, 40% of the score, and its parts | Traffic, noise (where the city publishes noise maps), summer shade, busy roads and slope. Summer shade failed its published check, so treat that part as an estimate. |
| Place | The six-sided cell with 55 m sides and a street that the result describes. |
Files for your addresses or areas
Send a list of addresses or areas. You receive the fields below as a file, for example a CSV file that opens in any spreadsheet.
API access
Your software asks our server for the fields below, place by place. We arrange access for each customer.
Area and city reports, written for you on request
You receive a report on one area or one city, written for you on request. It shows the scores and the walking minutes behind them.
Custom rankings
You get every district of a city ranked by score, in the Hamburg format. We make this for your city on request, and we confirm the date when you ask.
Updates and support
We provide updates to the data and support, on terms agreed with you.
Why you can trust the score
A score is only useful if you can see how it is built and how it was tested. Here's both, with the checks that failed.
| Check | Agreement | Agreement | Pass mark | Result |
|---|---|---|---|---|
| France, neighbourhoodsINSEE census 2021, walk to work; middle city of 28 | 0.73 | 0.35 | Pass | |
| Ireland, neighbourhoodsCSO census 2022; middle of 34 counties and cities | 0.68 | 0.35 | Pass | |
| England and Wales, neighbourhoodsONS Census 2021; middle of 301 council areas | 0.62 | 0.35 | Pass | |
| Busy roadsStreet audit of 43 European city centres (Bartzokas-Tsiompras and Photis, 2021) | 0.56 | 0.40 | Pass | |
| Cities against citiesEurostat city walking shares, 195 cities in the first 20 countries on the map | −0.04 (0.43 for walk or public transport) | 0.50 | Fail | |
| Summer shadeTree cover in the same 43 city centres | −0.18 (0.27 for trees alone) | 0.40 | Fail | |
| Ten US cities, run only to test the methodAmerican Community Survey 2020 to 2024, about 3,000 small census areas | 0.34 | 0.35 | Fail, narrowly |
Agreement is a correlation. 1 means the two measures move together exactly. 0 means no relation. Below 0 means they move in opposite directions. Full details, including every failed check, on /about#checks.
The method, on one screen
Reach counts for 60%: walking minutes on real streets to eight daily needs. Street quality counts for 40%: traffic, noise where a city publishes noise maps, summer shade, busy roads and slope. If street quality is under 40, the score stays at 69 or lower. That means a place with many shops on loud, busy roads can't score high. One method covers all 31 countries, so a street in Lyon is scored the same way as a street in Porto or Poznań.
Checked against census data
We compared the scores with census data, the official count of a country's people, on how many people walk to work. This comparison runs neighbourhood by neighbourhood. The pass mark of 0.35 was set before any result was seen. France passed at 0.73. England and Wales passed at 0.62. Ireland passed at 0.68. The other countries have no census check on this page.
The failed checks are published too
Not every check passed. City-level walking shares from Eurostat, the EU statistics office, gave -0.04. Summer shade gave -0.18, so treat the shade part of street quality as an estimate. A third check, a test of the method in the ten largest US cities, also failed, but only narrowly. The failed checks sit on the same page as the passes, so you know where the scores are less certain.
Open licence, paid service
The scores are built from public data, mostly OpenStreetMap, a map of the world that volunteers build. The scores and the map data are under the ODbL, an open database licence. Anyone may use and share them, also commercially, with credit to OpenStreetMap. You pay for the service. It covers scoring your addresses, delivery, reports, rankings, updates and support.
How Walkably compares with the other options
Four other routes are common: Walk Score, PriceHubble's location scores, the 15-Minute City Score map and your own build on OpenStreetMap. The table compares them using facts from each vendor's own pages. The source for every fact is on the 'How we compared' page, linked under the table. We read those pages on 14 October 2026. Cells are short; the linked pages hold the detail.
| - | Walkably | Walk Score | PriceHubble location scores | 15-Minute City Score Europe (Transform Transport) | Build your own on OpenStreetMap |
|---|---|---|---|---|---|
| Europe coverage | 31 European countries; every 55 m cell with a street. | Its pages list the United States and Canada. Its site shows some European streets with the label Unsupported Country. | Ten country codes for the location-score API: AT, BE, CH, CZ, DE, FR, JP, NL, SK, UK. | 786 functional urban areas with more than 50,000 inhabitants, in the EEA38 countries plus the UK. | Any area in the Europe extract (32.8 GB). |
| What is measured | Walking minutes to eight daily needs (60%) and street quality (40%). | Distance to amenities; points fall after a 5-minute walk and stop at 30; plus block length and intersection density. | Nine scores: family, location, noise, nuisance, shopping, view, catering, health, leisure. The docs do not say whether walking time is used. | Walking at 4.5 km/h to eight service categories, 0 to 100, in six-sided cells of about 0.1 km2. | Whatever you define. Routing software such as OSRM or Valhalla gives walking times. |
| Public method | Yes, on /about. | Yes, on its methodology page. | Not explained on the docs page. | Yes, on the project page. | Your own. |
| Published checks | Census comparisons for three countries, failures included, on /about#checks. | Independent US studies; a 2011 four-metro study reports moderate correlation with map-based measures, per its abstract. We found no European check on its pages, 14 October 2026. | We found none on its pages, 14 October 2026. | Tested on over 112 European cities, per its page. It reports no validation against observed walking. | Your own to run. |
| Licence and storing results | Scores and map data under the ODbL: use, store and publish with credit. Service terms (delivery, API access, support) agreed per customer, in writing. | Display on a free site the licensee owns; storing results needs Walk Score's written approval; the Premium plan lists it. | Not found on its pages. | Creative Commons BY-NC-SA 4.0: non-commercial use only, and derived work must be shared under the same licence. | ODbL: use and adapt with credit; a database you build on it and publish is shared under the same licence. |
| How you buy | Email with your volume; no public price list. Files, API access (your software asks our server), reports and rankings, each arranged per customer. | Free plan for free consumer apps; Premium from $115 a month, quoted per site; data files on request. | API; no public price found. | Free download from Zenodo, a site where researchers share data. | Free data and free software; your engineering time. |
Read on each vendor's own pages on 14 October 2026. Where a cell says we found none, we searched that vendor's public pages on that date. Google's terms for European customers allow storing place coordinates for 30 days at most. Mapbox's terms name real estate among the uses that need a separate commercial licence before production use. On map completeness: a 2021 study of shops in two German states found OpenStreetMap completeness of 42% to 100% by district. It judged mean completeness high. If a fact here is out of date, tell us: [email protected].
What Walkably does differently
One method covers 31 countries at 55 m detail. Street quality is built into the score, and published checks include the failures.
What to check before you buy
There is no public price list; you write for a quote. Detail depends on how well an area is mapped in OpenStreetMap, which can affect any score built on it. Single checks on the live map are free, so you can test your own areas first.
What the table leaves out
Local Logic covers every address in the United States and Canada and publishes prices for most plans. On the pages we read, it names no European country. Targomo sells travel times and a location-scoring API (your software asks its server); it returns raw scores by default. Its first price tier is EUR 2.00 per 1,000 operations. Private or stored use is quoted by its sales team, and results may not be permanently stored. For Google, Mapbox, HERE and TomTom, we found no walkability score in their price lists or docs. We read them on 14 October 2026.
Questions buyers ask
Which countries does Walkably cover?
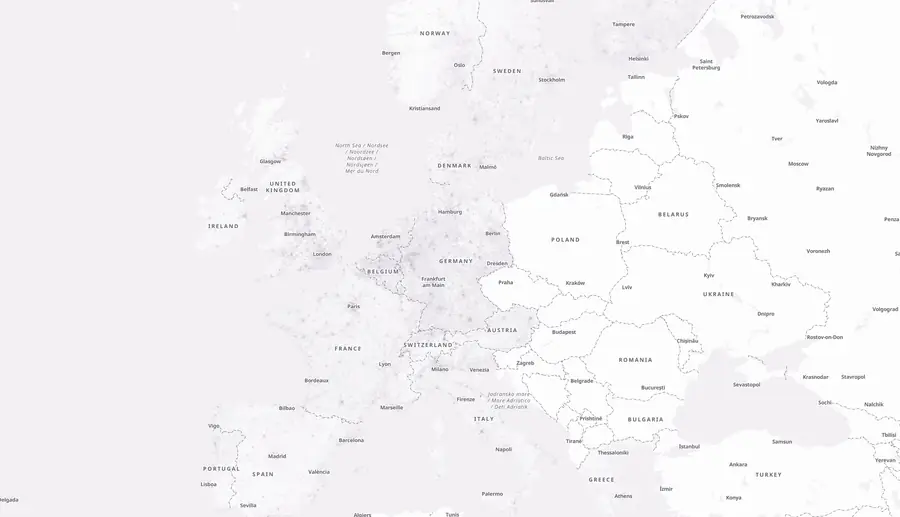
31 European countries: Andorra, Austria, Belgium, Bulgaria, Croatia, Cyprus, Czechia, Denmark, Estonia, Finland, France, Germany, Greece, Hungary, Iceland, Ireland, Italy, Latvia, Liechtenstein, Lithuania, Luxembourg, the Netherlands, Norway, Poland, Portugal, Slovakia, Slovenia, Spain, Sweden, Switzerland and the United Kingdom. Every 55 m cell with a street has a score.
What exactly do we get for one address?
The score from 0 to 100. Its two parts are reach and street quality. Walking minutes on real streets to eight daily needs. Individual street-quality parts: traffic, noise where the city publishes noise maps, summer shade, busy roads, and slope. The result describes the 55 m cell the address sits in. The St. Pauli example above shows each field with real values.
Can we use the scores in our own product or publish them?
Yes. The scores and the map data are under the ODbL, an open database licence. Anyone may use and share the scores, also commercially. You must credit the source and share a changed version under the same licence. You can build them into a product or publish them in a report. What we agree in writing with each customer is the service. This covers scoring your own addresses or areas, and delivering the result by file or API.
How do you know the scores are right?
We compared them with census data on how many people walk to work, neighbourhood by neighbourhood. The pass mark of 0.35 was set before any result was inspected. France passed at 0.73. England and Wales passed at 0.62. Ireland passed at 0.68. These are the three countries with a census check; the other countries have no census check on this page. Failed checks, including Eurostat city-level walking shares and summer shade, are published on /about#checks.
Summer shade failed its check. What does that mean for the score?
Shade is one of five street-quality parts, and street quality makes up 40% of the score. The check compared our shade with an independent street audit, and the two didn't agree (-0.18). Treat the shade part as an estimate. Read the check on /about#checks before relying on shade on its own.
What about areas that are poorly mapped in OpenStreetMap?
The score is only as complete as the map under it. A 2021 study of shops in two German states found OpenStreetMap completeness between 42% and 100% by district. It judged mean completeness high. This can affect any score built on OpenStreetMap, ours included. Single checks on the live map are free, so you can test your own areas before buying.
In what format do the files come, and how often is the data updated?
Files come in a spreadsheet format such as CSV, with the fields listed above. The Hamburg district download shows the structure. Updates are part of the service. State in your email how often your work needs them, and we agree the rhythm in the terms.
What happens to the address list we send you?
We use it to score your addresses and deliver the result to you. Tell us in your email what your legal team needs, such as a data processing agreement. It becomes part of the terms we agree.
Can we test before we buy?
Single checks on the live map are free for anyone. The Hamburg district ranking and the 477 city pages are open too. State in your email if you want a test on a few of your own addresses first.
What does it cost?
We don't publish prices. Write to [email protected] with your expected volume and target countries or cities. Tell us what the scores are for, and we reply with the terms.
Who makes Walkably?
Raian Pollock. The method and the data sources are on the About page, and so is every check, passed or failed.
Coming soon to Walkably
- District rankings like Hamburg's for more cities.
- A population and age layer.
- City pages in more local languages.
- More countries beyond the 31.
How a purchase works
There is no price list, form, or demo booking. One email starts it. Single checks on the live map stay free for anyone.
[email protected]Subject: Walkability data request: [organisation], [countries or cities], [number of addresses or areas]1. Write to us with your volume
Email [email protected]. Tell us how many addresses or areas you have, and which countries or cities. Explain what the scores are for. Add what your legal team needs for data protection, such as a data processing agreement. Say if you want a test on a few addresses first. The subject line below helps us answer faster.
2. We reply with the form and the terms
We reply with the form that fits: files, API access (your software asks our server), a report, or a ranking. We also include our terms for delivery and support.
3. You receive the data
You receive files, API access or the report. Updates and support follow the agreed terms.
Or open the live map
Check any spot in the 31 countries, free.