 Walkably
Walkability score API for 31 European countries
Add a walking score to every listing, search result, or assistant answer in Europe. Each response gives the score, the minutes on foot to eight daily needs, and the street-quality parts behind it. Access is arranged per customer.
- 31European countries
- A score for every 55 m street cell
- Minutes on foot to 8 daily needs
- Checks published, failed ones included
What one spot returns
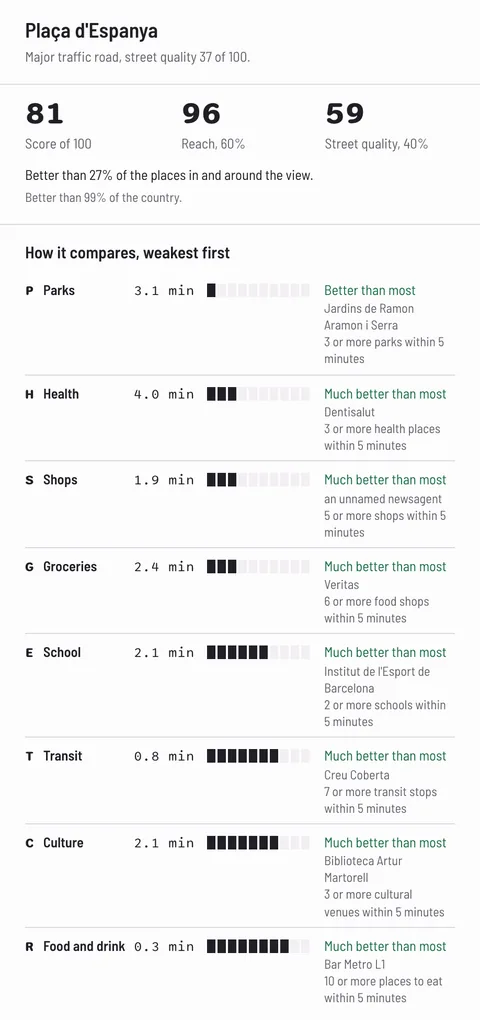
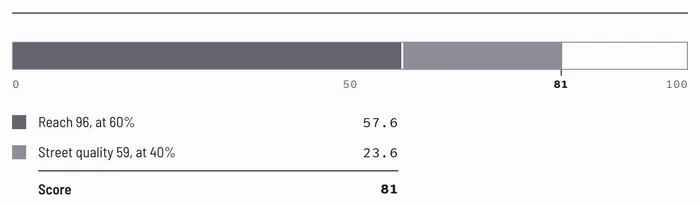
The response for one spot looks like this. The values are a sample, not a real reading, and the field names are an example. We agree the exact format with each customer. The score is 60% reach and 40% street quality. Reach is the walking minutes to eight daily needs. Street quality covers traffic, noise, summer shade, busy roads, and slope. Where a city doesn't publish a noise map, the noise field is empty. For a real reading, the About page shows Plaça d'Espanya in Barcelona: reach 96, street quality 59, score 81.
The score, 0 to 100
Every six-sided cell with sides of 55 metres and a street has a score. Reach makes up 60% of it and street quality 40%. If street quality is under 40, the score can't exceed 69.
Minutes on foot to each need
Eight needs: groceries, food and drink, shops, health, school, parks, culture, and public transport. Your product can show these eight numbers one by one, so users see how the score is made.
The street-quality parts
The five parts are traffic, noise where the city publishes a noise map, summer shade, busy roads, and slope. Summer shade is an estimate from building heights and tree maps. Its check against a street audit of trees in 43 city centres didn't pass (-0.18). It stays one of the five parts. Full details are on the About page.
Delivered the way you need it
We supply files with scores for your own addresses or areas on request. We also arrange API access for your product. Area and city reports are written for you on request. We prepare a district ranking for your city on request; we confirm the date when you ask. Updates and support are also part of the service.
{
  "sample": true,
  "score": 75,
  "reach": 82,
  "quality": 65,
  "minutes": {
    "groceries": 4,
    "food_and_drink": 3,
    "shops": 6,
    "health": 9,
    "school": 7,
    "parks": 5,
    "culture": 12,
    "public_transport": 2
  },
  "street_quality": {
    "traffic": 71,
    "noise": 54,
    "summer_shade": 58,
    "busy_roads": 66,
    "slope": 90
  }
}
Show what a place is like on foot
Your product shows places. Your users want to know what life is like there on foot.
Listings show what's for sale, not the street
A listing page gives the price and the floor plan. It doesn't say how many minutes the grocery or the school is on foot. Users must check that elsewhere, or they never do.
The best-known score APIs list the US and Canada
Walk Score's and Local Logic's own pages name those two countries. Walk Score's public site shows scores for some European streets, labelled Unsupported Country. For Europe, teams face three routes. A routing API plus your own places and rules. A scoring API you set up yourself. Or a finished score.
Building it yourself is a big project
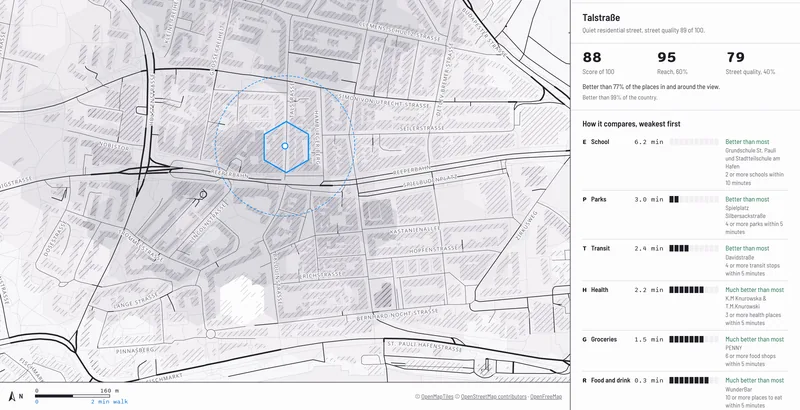
It requires a 32.8 GB downloaded map file. It also needs a routing server, which is a computer that calculates walking routes. You must choose and weigh eight place categories, then run tests. Walkably did that once for 31 countries. The tests are public.
What teams build with it
The same fields serve a listing page, a search filter, a district page, a matching engine, or an assistant. Each use gets the score and the minutes behind it.
A location check on every listing
Show the score next to the price, with the minutes to groceries and public transport under it.
Every listing shows one number and the eight walking times behind it, in 31 countries.
Search and sort by walkability
Show only spots above a score the user chooses. Or sort results by walking time to a school or a station.
One filter, one method in all 31 countries. Noise counts only where a city publishes a noise map.
District pages
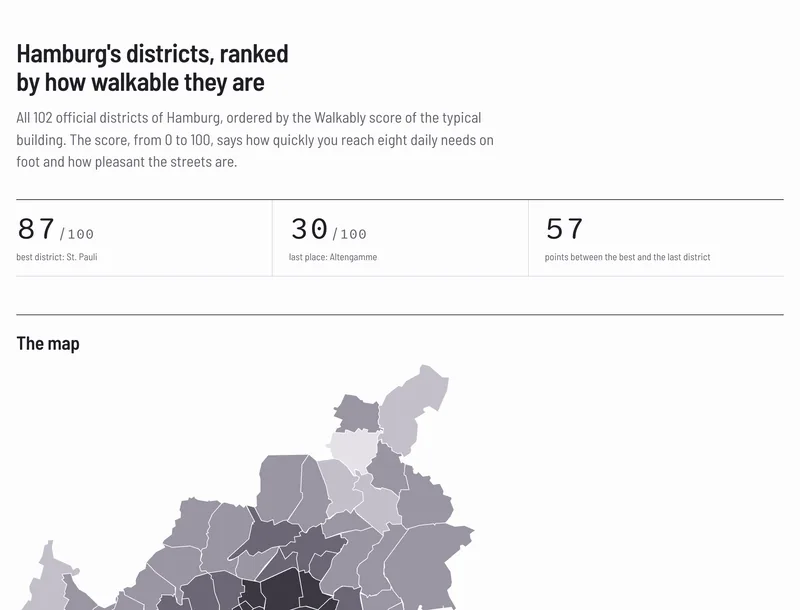
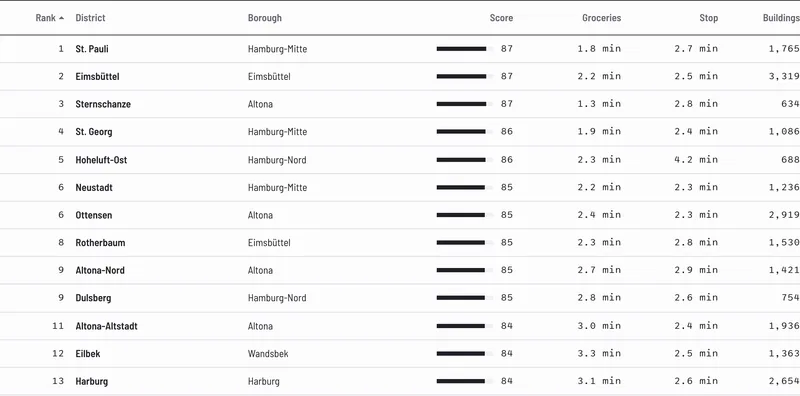
Build a page per district with its own typical score and the areas best and least served by daily needs on foot. Our Hamburg district ranking shows an example: 93 ranked districts on a map and in a sortable table.
A page per district with its own typical score, the areas best and least served by daily needs on foot.
City pages
Our 477 city pages cover cities of about 100,000 people or more. Each gives the typical score, the areas best and least served by daily needs on foot, and the rank in the country.
The same four facts for every large city in 31 countries: typical score, best and least served areas, and country rank.
Assistants that answer with a number
Give a chat assistant or recommendation engine the score and the minutes as facts. It answers questions about walking distance to groceries with a figure from real streets.
Location answers your users can check on the map.
Relocation and rental matching
Match a person's needs against spots in any of the 31 countries. A park within 5 minutes, for example, plus a school within 10.
Matches explained in minutes rather than a vague label.
How access works
There's no self-serve key. We arrange access for each customer. It takes three steps. You write to us. You check a file. Then we connect your product.
1. Write to us
Tell us your countries and your volume. Say whether you want a file or the API, or both. We write back.
2. Start with a file
A good first step is a file with scores for your own addresses or areas. You check the numbers against places you know before you write code. We can discuss a file for your own addresses when you write to us.
3. Connect your product
We arrange API access for your use and agree the format and the update rhythm with you. Updates and support are part of the service.
Why you can trust the number
The score can be checked before you buy. The census checks that passed cover France, England and Wales, and Ireland.
The method is public
The score is 60% reach and 40% street quality. It covers eight daily needs and five street-quality parts. The full method is in the 'How the score works' section of the About page.
Checked against census data
We compared scores with census data on walking to work, neighbourhood by neighbourhood. France reached 0.73 typical agreement, Ireland 0.68, and England and Wales 0.62. Agreement runs from -1 to 1. A value of 0 means no link. A value of 1 means the two always move together. Below 0 means they move in opposite directions. The pass mark was 0.35, set before we saw any result.
Failed checks are published too
Three checks did not pass: Eurostat (the EU statistics office) city-level walking shares scored -0.04, summer shade scored -0.18, and the ten largest US cities scored 0.34 against a pass mark of 0.35, a narrow fail. We publish them on the About page beside the passes.
Built from public data
The scores and the map data under them, mostly OpenStreetMap, are under the ODbL (Open Database Licence). Anyone can use and share them with credit. What you pay for is the service: delivery and API access, reports or custom rankings, updates, and support.
Free single checks for anyone
Check any spot on the live map. Try your own address before you write to us, and see whether the number matches what you know about the street.
How it compares
A buyer checks these facts first. Cells about vendors come from the vendors' own pages, read on 14 Oct 2026. Other sources are named in the cell. 'Not found' means we didn't find it on the pages named.
| Option | Europe coverage | What you get | Public method and checks | Storing results | How you buy |
|---|---|---|---|---|---|
| Walkably | 31 countries, every 55 m cell with a street | Score 0 to 100, minutes to 8 needs, street-quality parts | Method on /about#how. Census checks for France, England and Wales, Ireland; failed checks published | Service terms agreed in writing per customer. Scores and map data are ODbL (Open Database Licence): use and share with credit | Per customer; write with your volume; no public price list |
| Walk Score API | Officially the US and Canada. Its public site shows scores for some European streets, labelled Unsupported Country | Walk Score; also Transit Score and Bike Score | Method public. Studies we found (Duncan et al. 2011) compare it with GIS measures in four US metros | Needs Walk Score's written approval; the Premium plan includes it. Display must be on a freely accessible site owned by the licensee | Free plan: 5,000 calls a day for free consumer apps. Premium from $115 a month, quoted per site |
| Local Logic | Every address in the US and Canada | 18 location scores, 36 place categories | Not found on its pricing and docs pages | Not found on its pricing and docs pages | From $1,500 per API a month, priced by API calls |
| Targomo Location Scoring API | 25+ countries, per its site (the site also says 30+) | Raw scores on criteria you choose; pre-built ratings on request | You define the score. The method and the tests are yours | Results may not be permanently stored for future re-use | €2.00 per 1,000 operations (its billing unit) up to 150,000 a month; €1.00 at 1 to 2 million. €300 of free monthly use for public apps. Private use needs a sales quote |
| Routing APIs (Mapbox Isochrone, HERE Isoline, TomTom) | World map data | The area you can reach on foot in a set time. No score. TomTom Reachable Range does not accept walking | No score to check. You add places and rules, then you test | Mapbox: you may not pass the licence on, and you must delete the data when the contract ends. Real-estate and analytics apps need a separate commercial licence for production | Mapbox: 100,000 requests free a month, then $2.00 per 1,000, down to $1.20 from 1 to 5 million; above that, contact sales. HERE: contact sales. TomTom: no per-unit price on its page |
| Google Places API | World map data | Places near a point, not walking minutes. No score | No score to check | Coordinates may be cached for 30 days, place IDs longer. The terms bar creating your own content from Google Maps content, such as point-in-polygon analysis on Places coordinates | Nearby Search Pro: $32 per 1,000 calls for the first 100,000 a month, 5,000 free; $9.60 at 1 to 5 million. One call per need means about $0.26 per address at the first price, about $0.08 at 1 to 5 million (our arithmetic). Routing costs come on top |
| 15-Minute City Score Europe (research map) | 786 functional urban areas above 50,000 inhabitants | A 0 to 100 score per hexagon over eight place categories | Method described on its page; no validation step described | CC BY-NC-SA 4.0: non-commercial, share-alike | Download on Zenodo. The licence excludes commercial products |
| Build it yourself (OpenStreetMap, OSRM or Valhalla) | All of Europe: a 32.8 GB file from Geofabrik under ODbL | Whatever you build. OSRM and Valhalla (free routing programs) do the routing. Places, rules, score and tests are your work | Yours to define and test. A 2021 study (Brückner et al., AGILE-GISS) of shops in two German states found completeness of 42% to 100% across districts; mean completeness was high | Yours. A database built on the data stays under ODbL when you share it publicly | Free data and software; your servers and your engineers' time |
Read on 14 Oct 2026 from the pages listed under sources. Vendor prices are the first price level unless stated, and they change; check the vendors' price pages before you decide. The OpenStreetMap completeness point applies to Walkably too.
Against a routing API
Routing APIs such as Mapbox and HERE return the area you can reach in a set time (an isochrone). You still must add places, choose rules for each need, and build a score. Walkably returns the finished score and the minutes.
Against Google Places
Google returns places near a point, not walking minutes. If you make one call per need, a score over eight needs costs about eight calls per address. Routing costs come on top. Google's terms limit how long coordinates may be stored. Walkably's scores are under the ODbL, so you may store them, with credit.
Where Walkably is weaker
There is no public price list and no self-serve key. The census checks that passed cover three countries: France, England and Wales, and Ireland. The same OpenStreetMap gaps affect it as any option built on OpenStreetMap. This is why the checks are published.
Questions buyers ask
Is there a self-serve key?
No. We arrange access for each customer. Write to us with your countries and your volume. The sample above shows the fields, and we agree the exact format with you.
Which countries are covered? Is the US included?
31 countries: the UK, Ireland, Iceland, Norway, Sweden, Finland, Denmark, Estonia, Latvia, Lithuania, Poland, Czechia, Slovakia, Hungary, Slovenia, Croatia, Germany, Austria, Switzerland, Liechtenstein, the Netherlands, Belgium, Luxembourg, France, Spain, Portugal, Andorra, Italy, Greece, Cyprus and Bulgaria. The US and Canada aren't covered. Walk Score's and Local Logic's own pages list those two.
What does it cost?
There's no public price list. What you pay for is the service: delivery and API access, reports or custom rankings, updates and support. Write to [email protected] with your volume and your countries. We write back.
Can we store the results and show them on our own map?
Yes. The scores are under the ODbL (Open Database Licence), the same licence as the OpenStreetMap data under them. You can store them and show them on your own map, also commercially, with credit to OpenStreetMap. If you share a changed version of the database publicly, it stays under the ODbL. Delivery, API access and support are agreed in writing with each customer.
Can we test before we build?
Yes. Check single spots for free on the live map. We can discuss a file for your own addresses when you write to us. You check the numbers against places you know before you write any code.
Was every country checked against census data?
No. The census checks cover France, England and Wales, and Ireland. All three passed the pass mark of 0.35. The failed checks, on city-level walking shares and summer shade, are published on the About page.
What if OpenStreetMap is thin in our area?
Then the score is weaker there, as with any score built on OpenStreetMap. A 2021 study of shops in two German states found completeness between 42% and 100% across districts; mean completeness was high. That's why we publish our checks, failed ones included. It's also why we suggest a file for your own addresses first. Noise is present only where the city publishes a noise map.
How often is the data updated?
Updates are part of the service. We agree the update rhythm with you when we arrange access.
Coming soon to Walkably
- District rankings like Hamburg's for more cities.
- A population and age layer.
- More countries beyond the 31.
Request API access
Write to [email protected]. Say which countries you need and how many spots you want to score. Say whether you want a file or the API, or both. We write back. No form needed: you can also check a spot on the live map first.
[email protected]Real estate portalsProperty developersCities and regionsConsultanciesBusiness overview