 Walkably
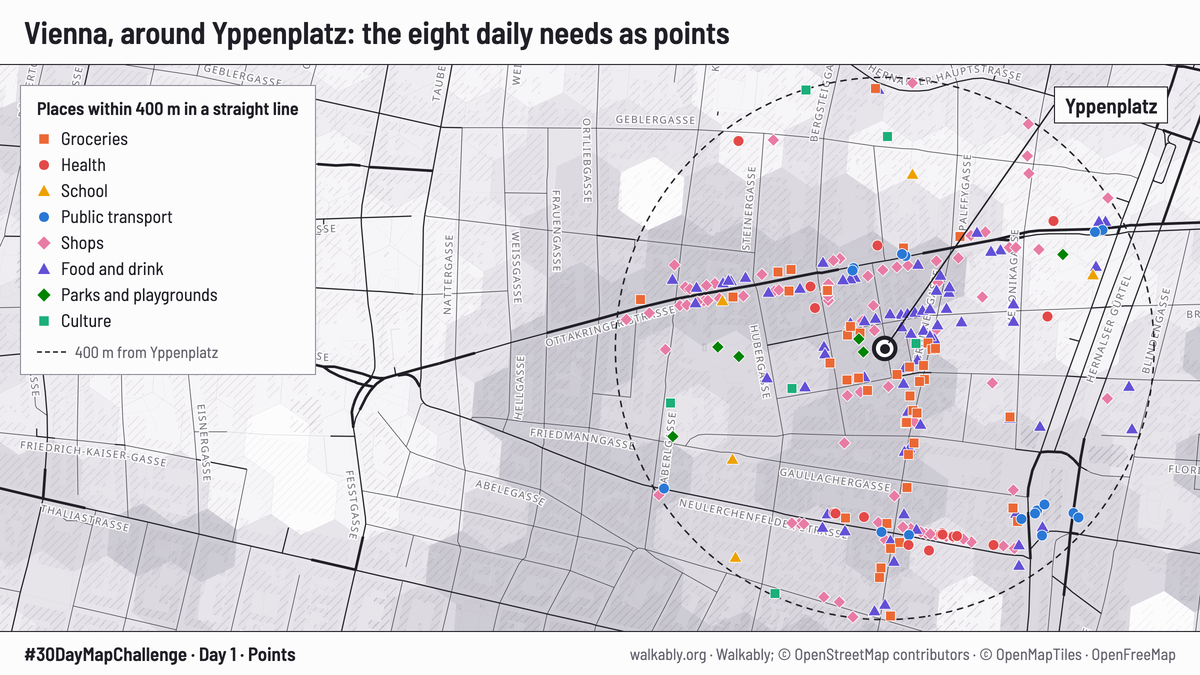
Day 1: Points. Vienna, around Yppenplatz
- What it shows
- The 251 places of our eight daily needs that lie within 400 m of Yppenplatz in Ottakring, one symbol for each need. Private green places are left out, as the score leaves them out.
- Figures
- 251 places within 400 m (straight line) of Yppenplatz
- Data and credit
- Walkably; © OpenStreetMap contributors (ODbL); base map © OpenMapTiles, OpenFreeMap. Places: OpenStreetMap, Geofabrik extract of Vienna, 19 Oct 2026.
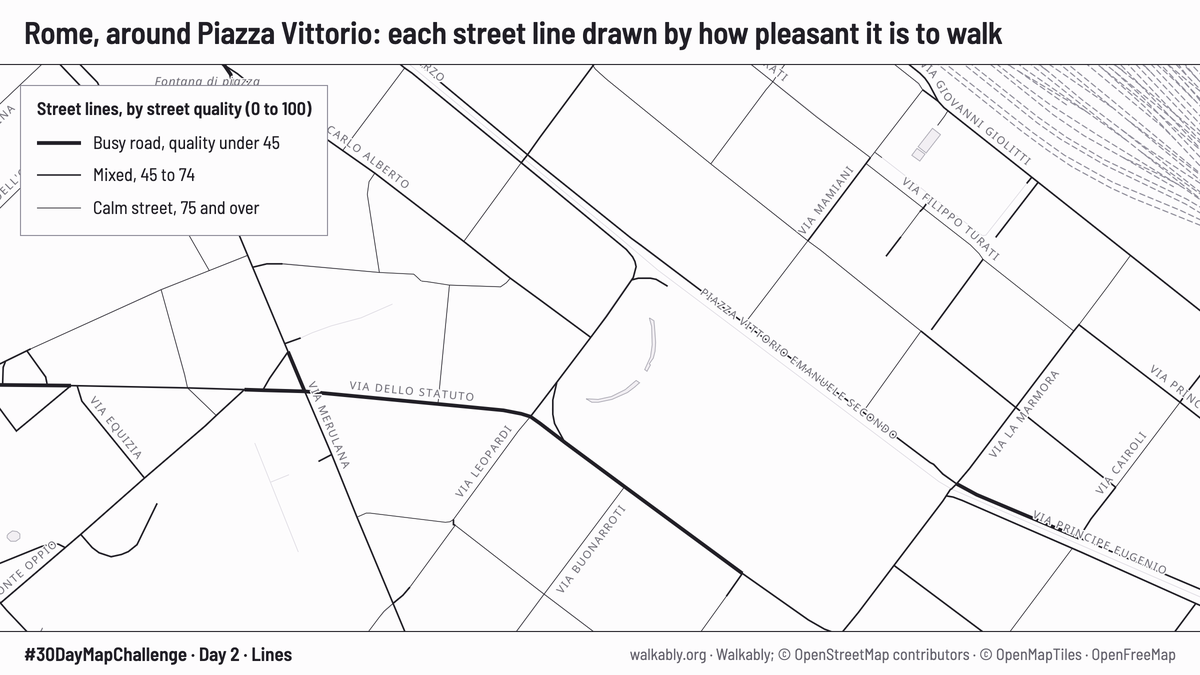
Day 2: Lines. Rome, around Piazza Vittorio
- What it shows
- The streets of the live map, as it draws them. A thicker line means a worse street for walking: a busy road. A thin line is a calm street.
- Figures
- Busy road: street quality under 45
- Mixed street: 45 to 74
- Calm street: 75 and over
- Data and credit
- Walkably; © OpenStreetMap contributors (ODbL); base map © OpenMapTiles, OpenFreeMap.
Day 3: Polygons. Hamburg, 104 districts
- What it shows
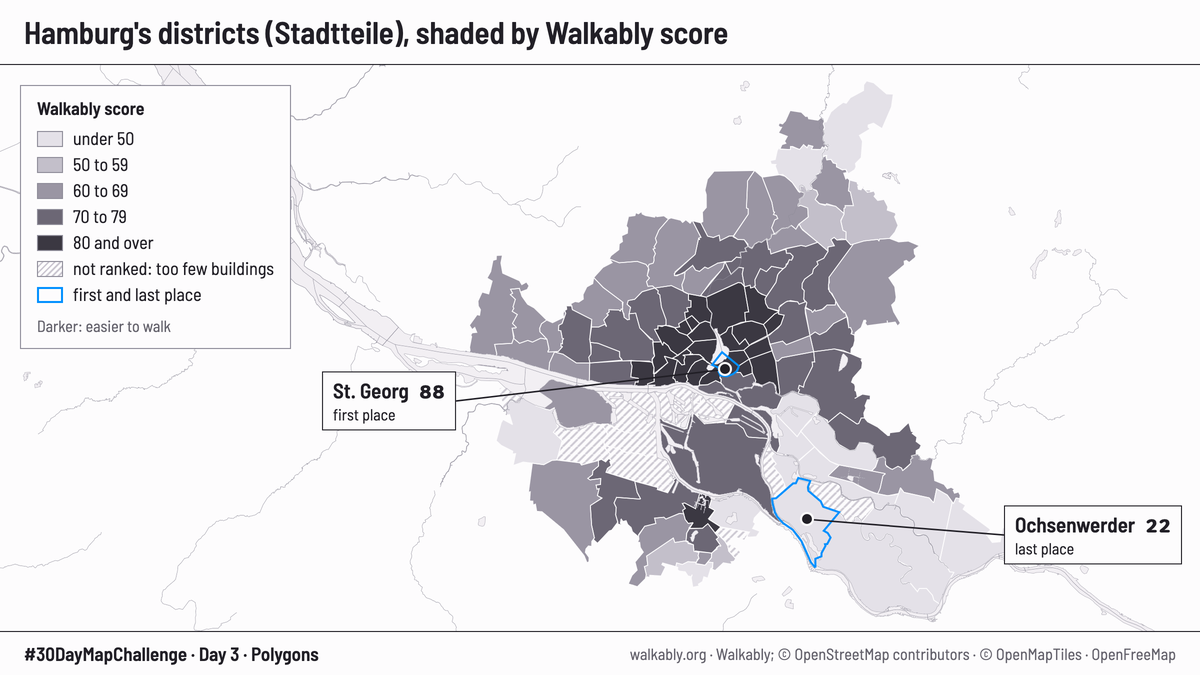
- Each of Hamburg's 104 Stadtteile (districts) is shaded by its Walkably score, in the site's five score bands. The darker the shade, the easier the district is to walk. First and last place have a blue outline. 11 districts are hatched: they have too few buildings for a score.
- Figures
- First place: St. Georg, 88 out of 100
- Last place: Ochsenwerder, 22 out of 100
- 11 of 104 districts have no score
- Data and credit
- Walkably; © OpenStreetMap contributors (ODbL).
Day 4: Clusters. Vienna, 39,265 scored cells
- What it shows
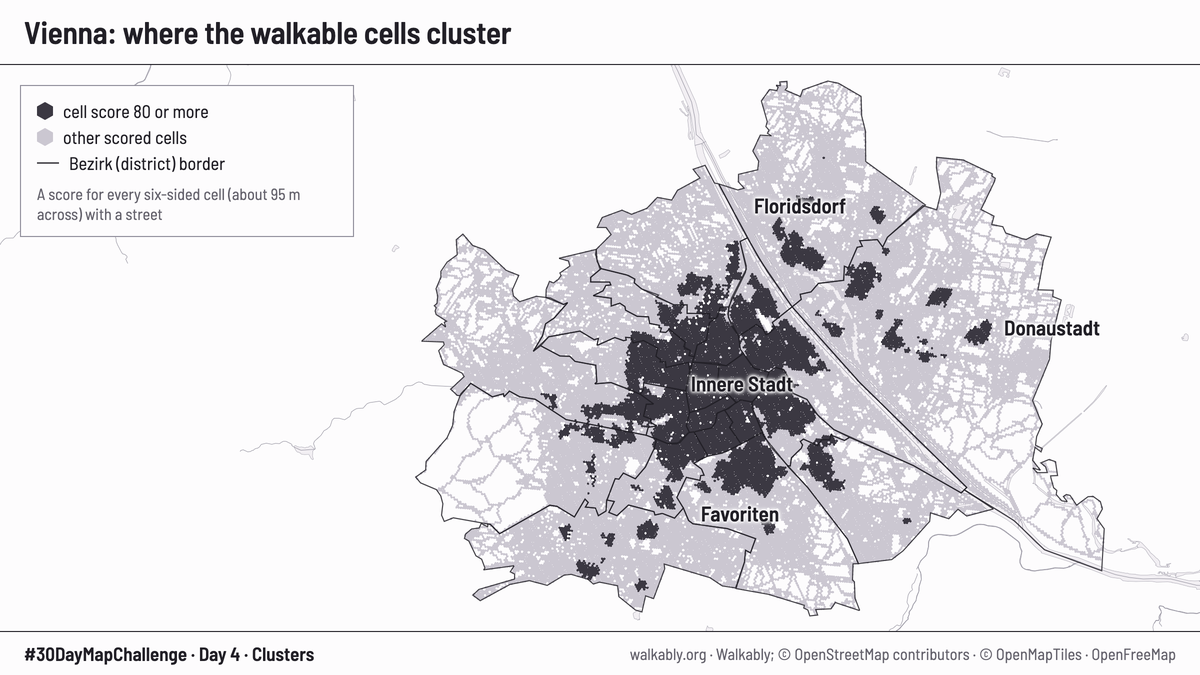
- Every hexagon cell of Vienna that has a street and a score. Cells that score 80 or more are dark, so the best places to walk show up as clusters. Each cell is about 95 m across.
- Figures
- 39,265 scored cells in Vienna
- Dark cells: score 80 or more
- 23 district borders
- Data and credit
- Walkably; © OpenStreetMap contributors (ODbL); base map © OpenMapTiles, OpenFreeMap.
Day 9: Urban-rural. Germany, from cities to countryside
- What it shows
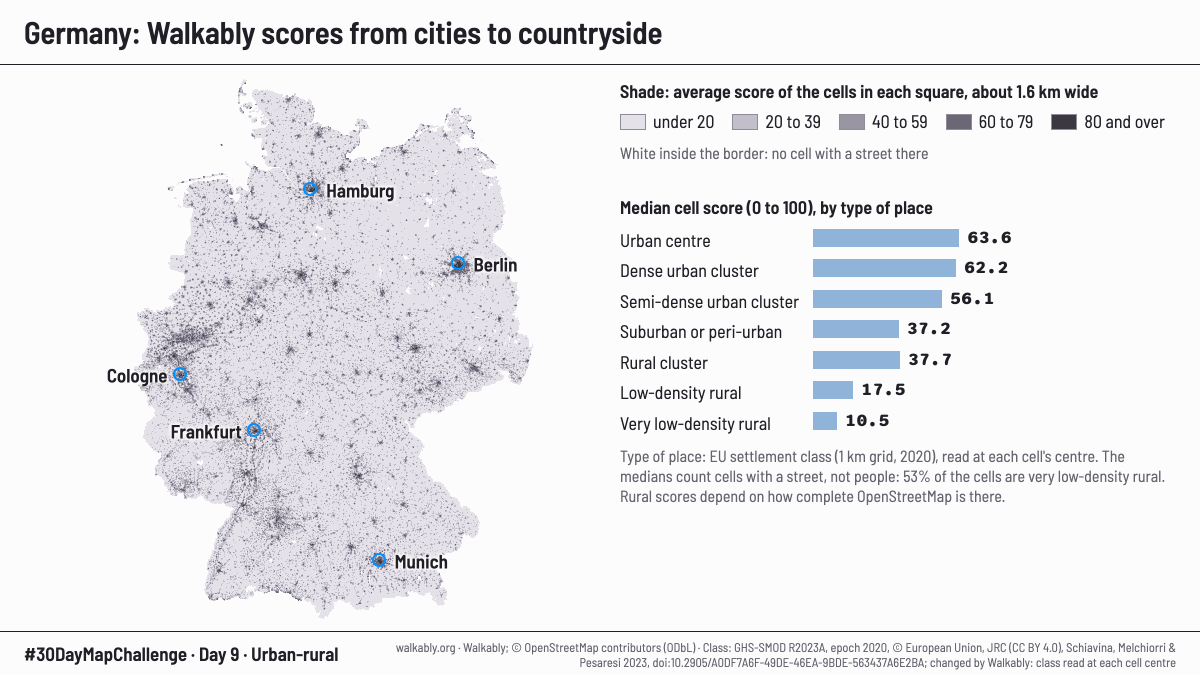
- All 21,716,671 scored cells of Germany. Each cell gets the settlement class of the place where its centre lies, from the European settlement grid. Each square on the map is shaded by the average score of the cells in it. The middle cell score of each class is the score of the cell in the middle when the cells are put in order. These scores count cells with a street, not people: 53% of the cells are in very low-density rural areas. Rural scores also depend on how complete OpenStreetMap is there.
- Figures
Middle cell score (0 to 100) by type of place Type of place and middle score Cells Urban centre 63.6 899,509 Dense urban cluster 62.2 592,932 Semi-dense urban cluster 56.1 239,426 Suburban or peri-urban 37.2 1,693,197 Rural cluster 37.7 1,097,794 Low-density rural 17.5 5,754,256 Very low-density rural 10.5 11,430,041 - Data and credit
- Walkably; © OpenStreetMap contributors (ODbL). Class: GHS-SMOD R2023A, epoch 2020, © European Union, JRC (CC BY 4.0), Schiavina, Melchiorri and Pesaresi 2023, doi:10.2905/A0DF7A6F-49DE-46EA-9BDE-563437A6E2BA. Changed by Walkably: class read at each cell centre.
Day 13: Interactions. Amsterdam, Singel
- What it shows
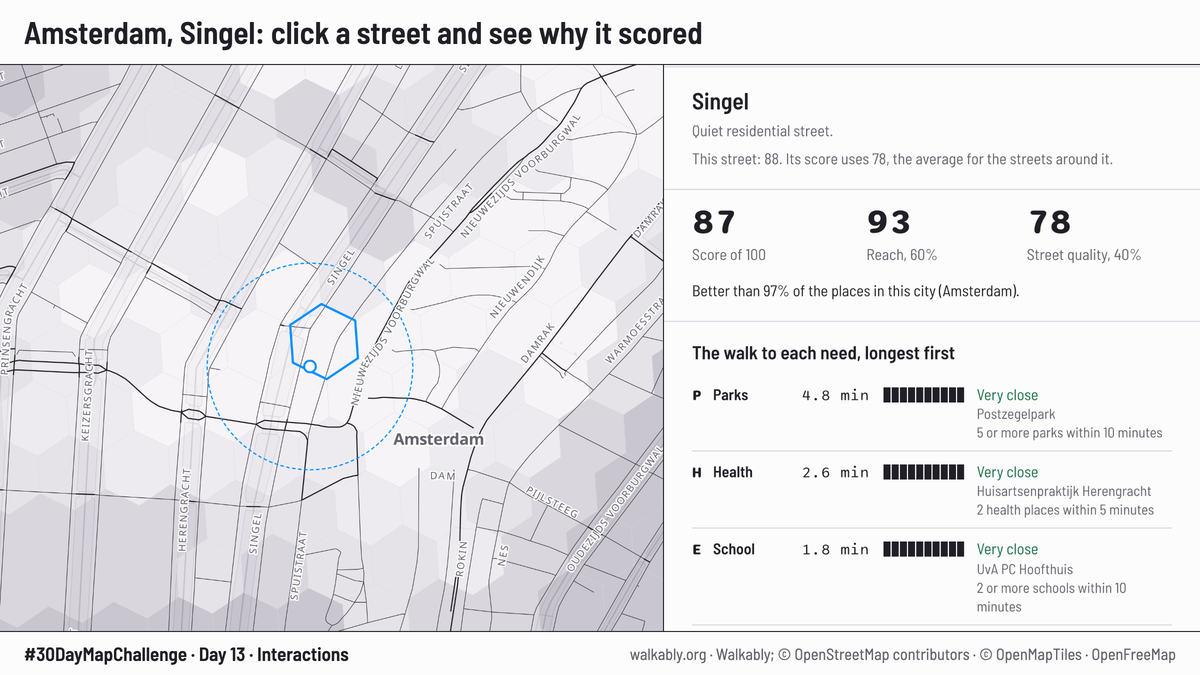
- A screenshot of the live map. Click a spot and the panel says why it scored. The score is 87 out of 100. Reach, the walk to the eight daily needs, is 93 and counts for 60%. Street quality is 78 and counts for 40%. The panel also says the spot is better than 97% of the places in Amsterdam. Captured on 25 Oct 2026; scores can change when we update the data.
- Figures
- Score 87
- Reach 93 (60% of the score)
- Street quality 78 (40% of the score)
- Better than 97% of the places in Amsterdam
- Data and credit
- Walkably; © OpenStreetMap contributors (ODbL); base map © OpenMapTiles, OpenFreeMap.
Day 20: Hexagons. Lisbon, Baixa and Chiado
- What it shows
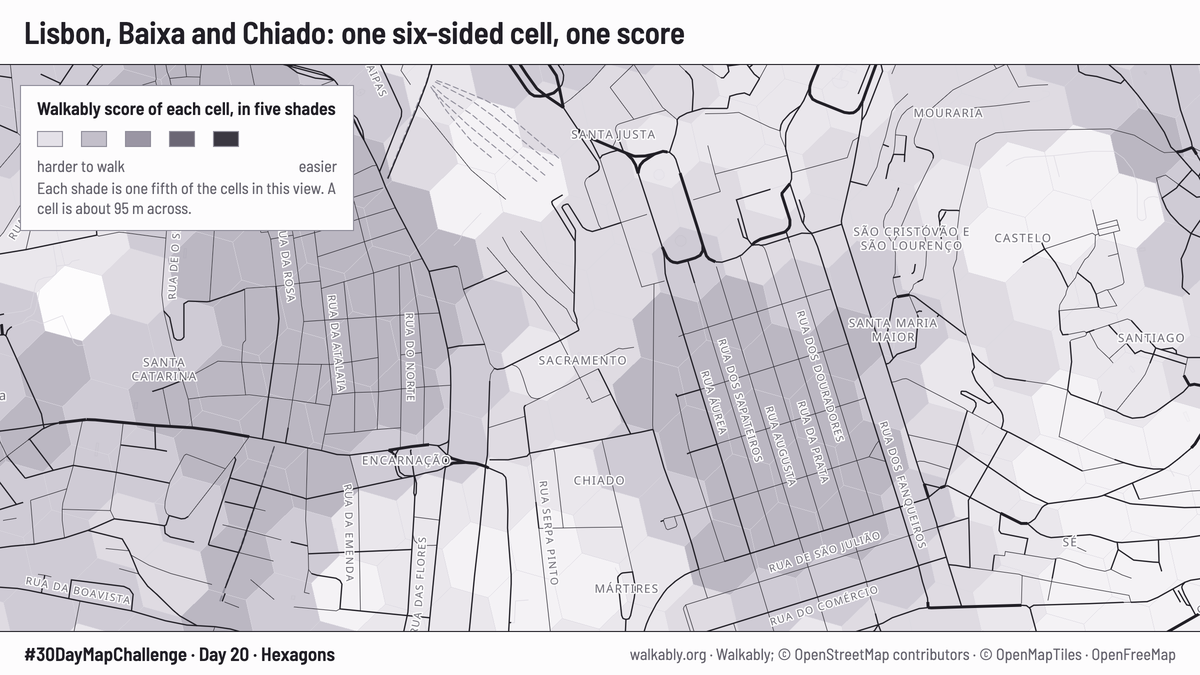
- A close view of the live map. Each hexagon cell is about 95 m across. At this zoom the shades come in five equal groups of the cells in view: the darkest shade is the best 20% of the cells you see, not a fixed score band. For this picture the buildings are hidden and the cells are drawn more strongly.
- Figures
- Five equal groups of the cells in view
- Cell size: about 95 m across
- Data and credit
- Walkably; © OpenStreetMap contributors (ODbL); base map © OpenMapTiles, OpenFreeMap.
Day 21: OpenStreetMap. Vienna, eight daily needs
- What it shows
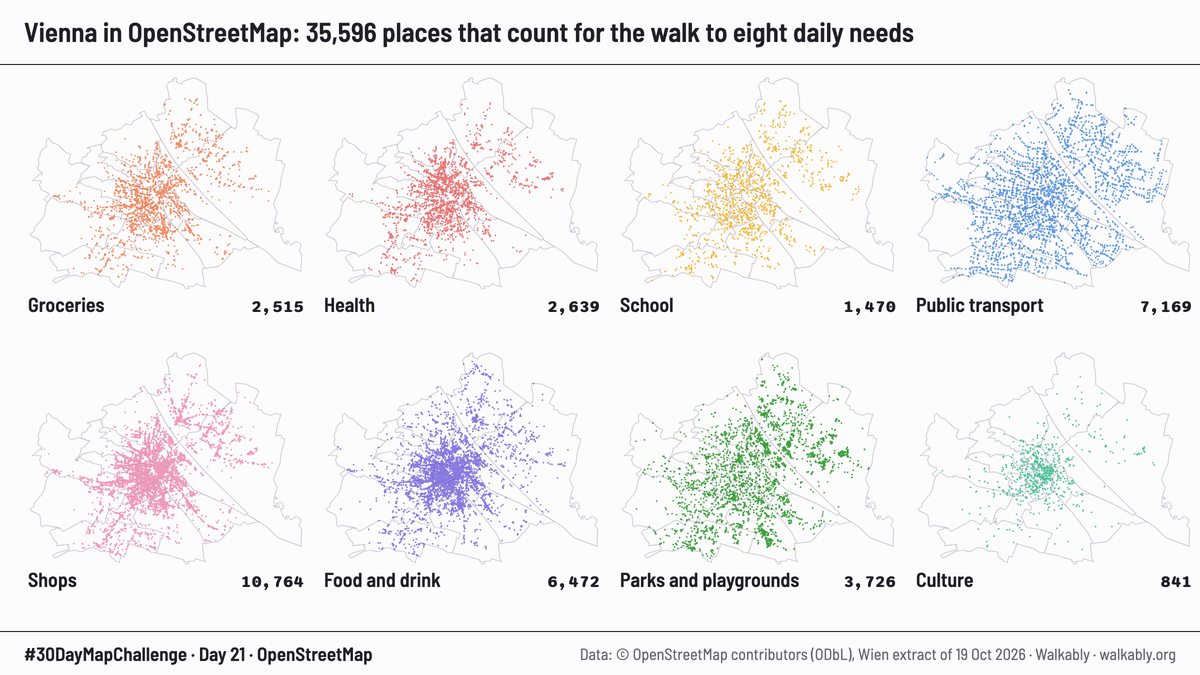
- Every place in Vienna that Walkably counts for its eight daily needs, one small map for each need. The places were added to OpenStreetMap by volunteers. The count covers the places we use for the score, not everything in OpenStreetMap. Private green places are left out, as in the score.
- Figures
- 35,596 places in eight maps
- Data and credit
- Walkably; © OpenStreetMap contributors (ODbL). Places: Geofabrik extract of Vienna, 19 Oct 2026.
Day 24: Network. Copenhagen, old centre
- What it shows
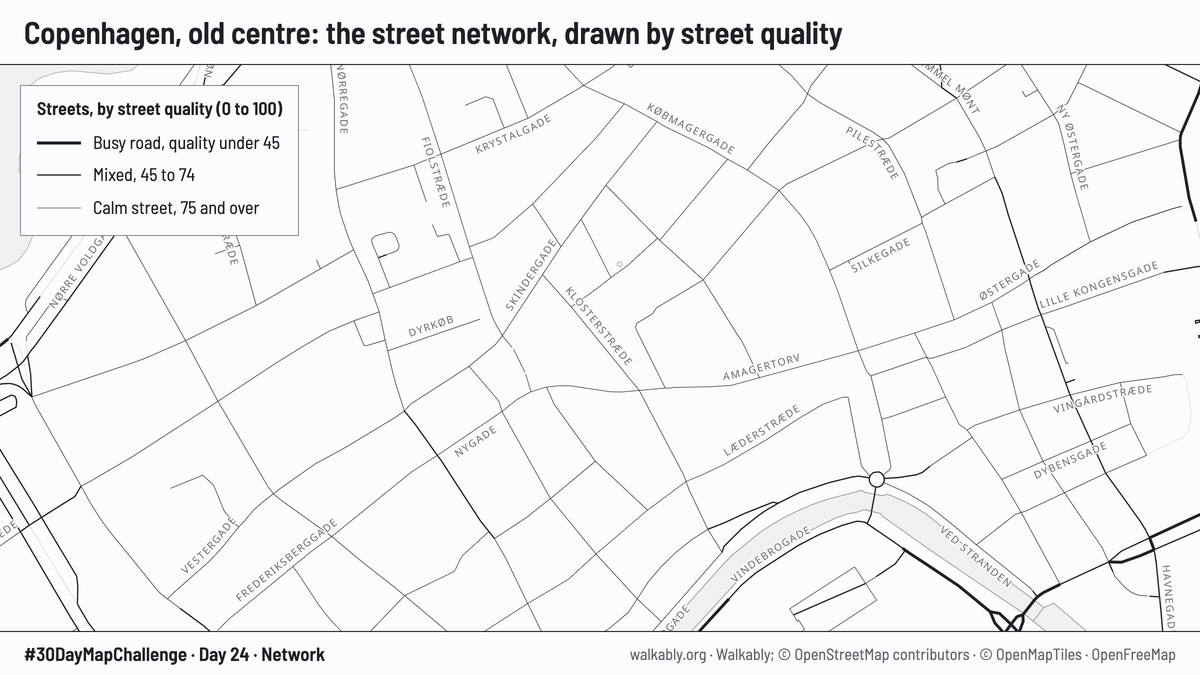
- The street network of Copenhagen's old centre as the live map draws it. A thicker line means a busier road. The cells and the buildings are hidden, so only the scored streets and the base map show.
- Figures
- Busy road: street quality under 45
- Mixed street: 45 to 74
- Calm street: 75 and over
- Data and credit
- Walkably; © OpenStreetMap contributors (ODbL); base map © OpenMapTiles, OpenFreeMap.
How the score works: About Walkably. The map, with every city: walkably.org. The Hamburg district ranking: Hamburg districts.